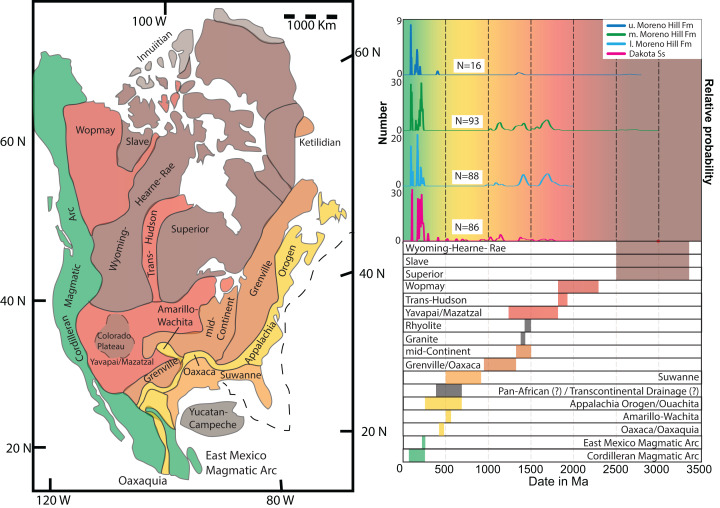
Figure 5. Detrital zircon provenance.
Combined possible crustal provenances and age-distribution curve for all analyzed detrital zircons from the Dakota Sandstone and the three Moreno Hill Formation samples. North American map displays likely crustal provenances for each major and minor detrital zircon age population reworked within the Cordilleran retroarc foreland basin system. Successive zircon age populations (displayed in the age-distribution curve on the right; and are displayed with color corresponding to the select crustal provinces). Modified and adapted from Dickinson & Gehrels (2009a) and Laskowski, DeCelles & Gehrels (2013); and references therein. Age placement based on Cohen et al. (2013, v2019/05). Figure also modified from Tucker et al. (2020). Probability density plots via Isoplot 4.15 (Ludwig, 2003).

