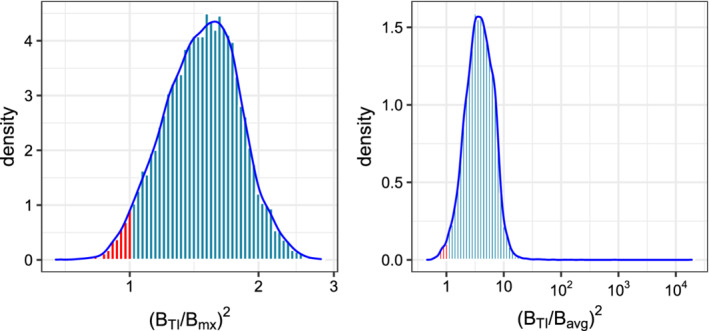
FIGURE 2.

Comparison of the asymptotic relative efficiency, as the ratio of test slopes, for the TI vs mx (left), and TI vs avg (right). The plots are the histograms of the ARE under a random Poisson‐Limit model, described in Section 5. The portions colored red correspond to models where the ARE of TI is lower than the competitors [Colour figure can be viewed at wileyonlinelibrary.com]
