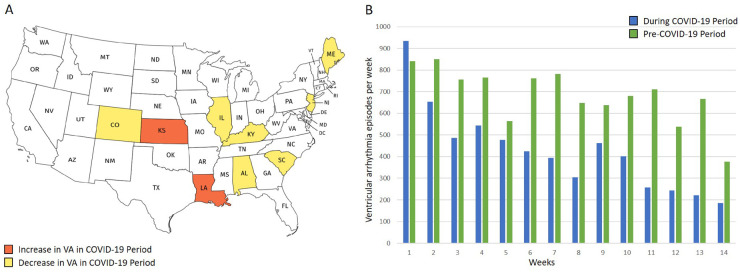
Figure 4.
(A) A map of the USA colour coded to denote which states saw an increase vs. a decrease in VAs during COVID-19, compared with the control period. (B) The number of VA episodes per week, before (control period: green) and during (COVID-19 period: blue) COVID-19. The figure demonstrates the natural incidental decline and incline in VA burden in the control period and highlights the markedly reducing burden of VAs during the COVID-19 period with social lockdown strategies.

