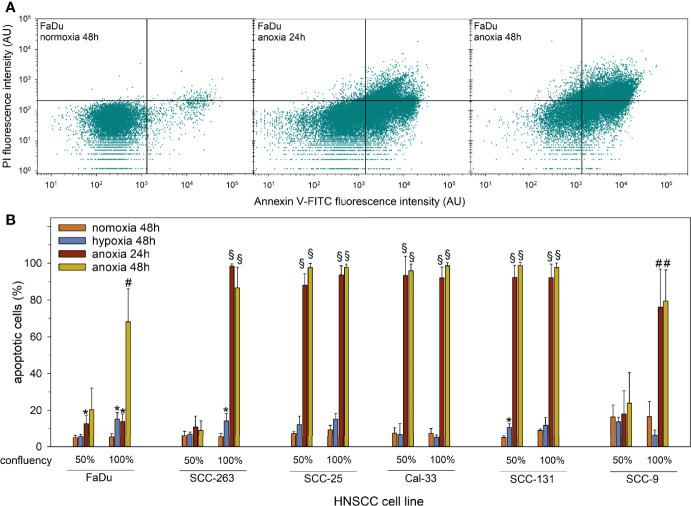
Figure 2.
Apoptosis in subconfluent or confluent HNSCC cells upon normoxia (21% O2, 48 h), mild hypoxia (1% O2, 48 h), or anoxia (<0.01% O2, 24 and 48 h) assessed by AnnexinV-FITC/PI staining and flow cytometry. (A) Representative dot plots of the measurement of AnnexinV-FITC and PI fluorescence intensities in FaDu cells treated with anoxia at full confluency. Vital cells are shown in the lower left quadrant (AnnexinV-FITC- and PI-), early apoptotic cells (AnnexinV-FITC+ and PI-) are shown in the lower right quadrant, and late apoptotic cells (AnnexinV-FITC+ and PI+) are shown in the upper right quadrant. (B) The fractions of apoptotic (total AnnexinV-FITC+) HNSCC cells are shown as mean values and standard deviations of at least three independent experiments performed with biological triplicates. Statistical comparison to normoxic cells was performed by students’ t-test, *p < 0.05, #p < 0.01, §p < 0.001.

