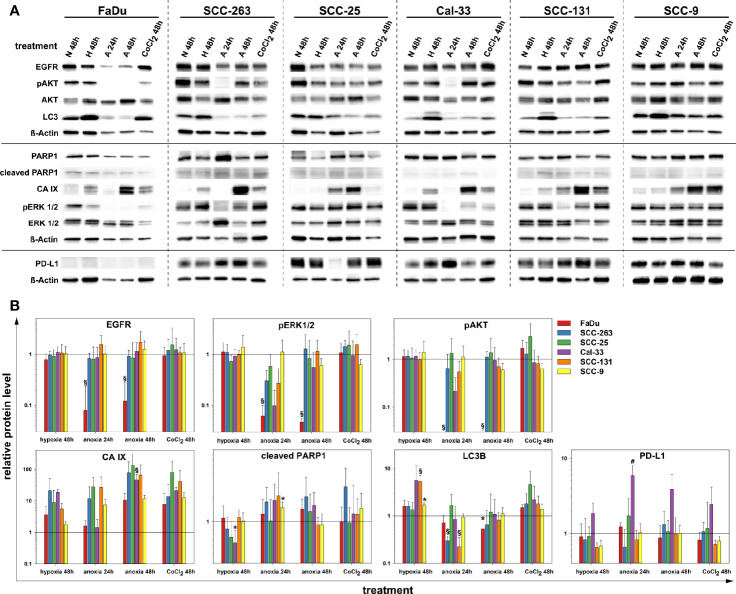
Figure 3.
Protein quantification of EGFR, pAKT (S473), AKT (pan), LC3B, PARP1, CA IX, pERK 1/2 (T202/Y204), ERK 1/2, PD-L1 and ß-Actin upon normoxia (N, 21% O2, 48 h), mild hypoxia (H, 1% O2, 48 h), anoxia (A, <0.01% O2, 24 and 48 h) and CoCl2 (150 µM, 48 h) in six HNSCC cell lines. Results are shown as (A) representative western blots, and (B) as relative protein levels after normalization to the level of ß-Actin related to normoxic cells. Relative protein levels are provided as mean values and standard deviations of at least three independent experiments performed with one biological sample. Statistics were performed by one way ANOVA, *p < 0.05, #p < 0.01, §p < 0.001.

