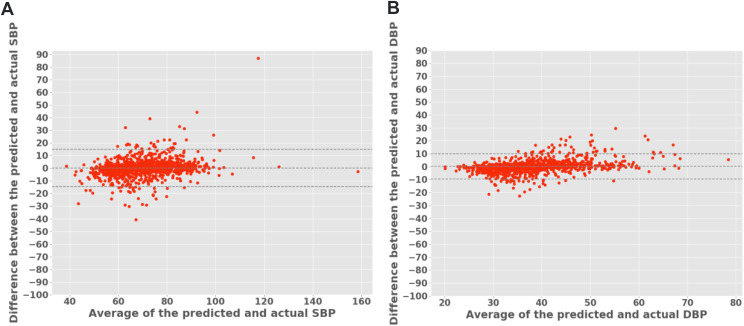
Figure 3. Bland-Altman plots for mean SBP and DBP values 10 seconds after obstructive respiratory events (ie, apneas and hypopneas) for the MBT model.
Most predictions of both SBP (A) and DBP (B) lay within the ± 1.96 SD of the distribution, indicating good agreement between predicted and measured blood pressure. DBP = diastolic blood pressure, SBP = systolic blood pressure, SD, standard deviation.

