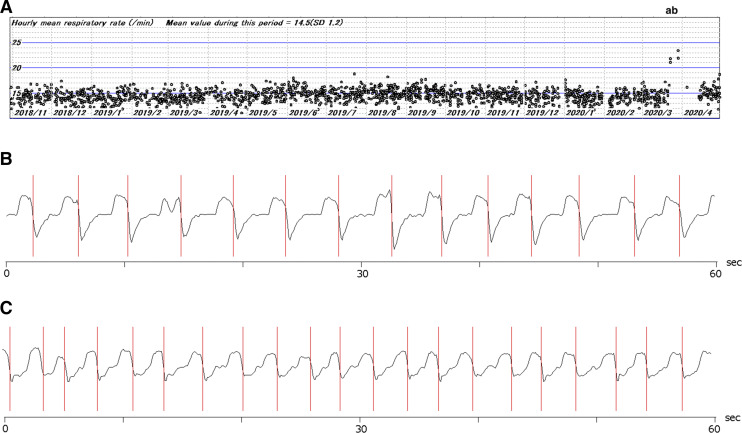
Figure 2. Respiratory rate obtained from CPAP flow records.
(A) The hourly respiratory rates for an 18-month period had been stable until 2 days before the onset of symptoms. A sudden surge in the respiratory rate (A) occurred on the night before the day of symptom onset. The increase in the respiratory rate was sustained until the night when the patient was admitted to hospital (B). His adherence to CPAP deteriorated, and he began receiving supplemental oxygen therapy after hospital admission. (B and C) Examples of raw flow rate trace for 60 seconds from the CPAP machine on a usual night (B) and at “a” (C). The vertical lines indicate the end-inspiratory points that were detected by the computer program and used to obtain the respiratory rate.

