Figure 5.
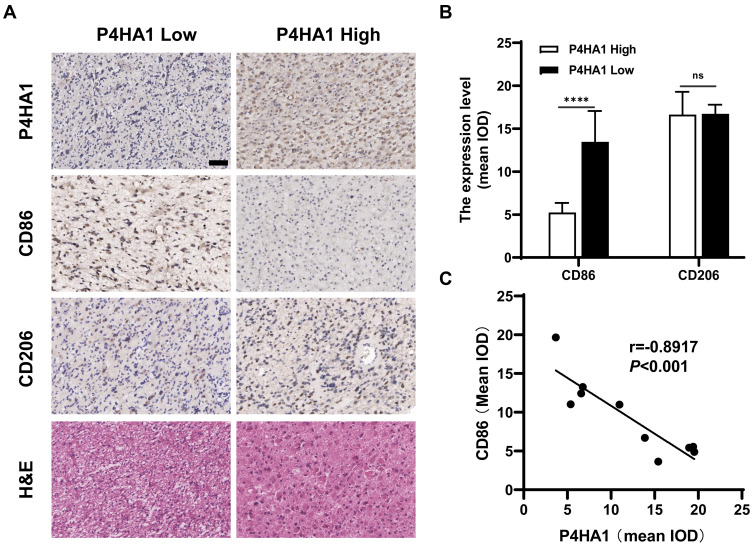
P4HA1 expression level negatively correlates with the CD86 M1 marker in GBM tissue specimens, but have no correlation with the CD206 M2 marker. (A) Results of hematoxylin and eosin and immunohistochemical staining. Scale bar, 50 μm. (B) In the P4HA1 low expression group, CD86 M1 marker expression was significantly higher than that in the P4HA1 high expression group, while CD206 M2 marker expression level did not differ between the two groups. ns, P > 0.05; ****P < 0.0001. (C) Correlation analysis was performed between P4HA1 and CD86. CD86 expression significantly negatively correlates with P4HA1 expression, P < 0.001, r = −0.8917.

