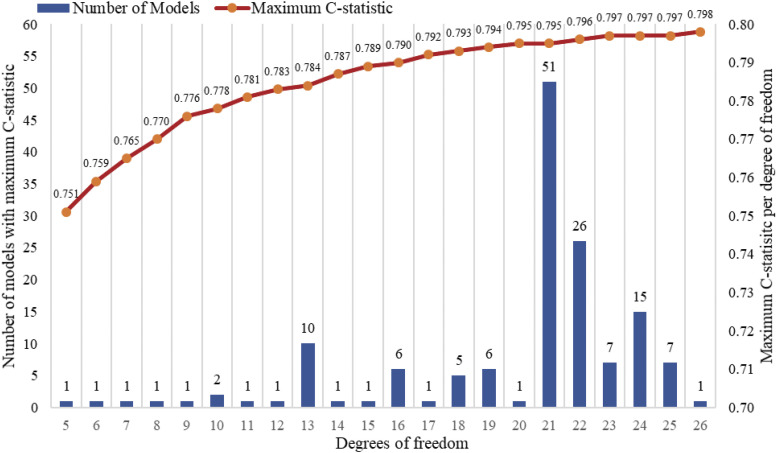
Figure 1. Number of models with maximum C-statistic per degrees of freedom.
X-axis represents the number of degrees of freedom in the model, which ranges from 5 to 26. Blue bars were used to mark the number of models with the same degrees of freedom and maximum C-statistic, whose values correspond to the Y-axis on the left side. The red line above the bars was connected by the orange dots showing the maximum C-statistic per degrees of freedom (Y-axis on the right side). For example, there are 51 models with 21 degrees of freedom that have a C-statistic of 0.795.

