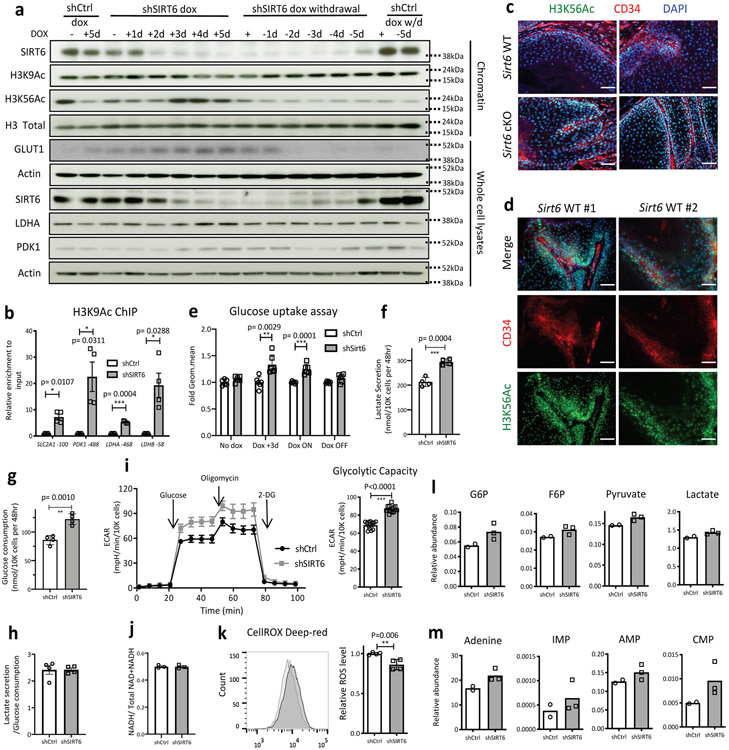
Extended Data Fig. 6. SIRT6 is an H3K56Ac and H3K9Ac deacetylase, regulating glycolysis.
Extended Data Figure 6 (related to Fig. 3). a, Chromatin fractions and whole cell lysates were extracted respectively and were analyzed by Western blot in doxycycline-inducible SIRT6 knockdown SCC13 cells as well as control cells over time. b, Chromatin immunoprecipitation assay against H3K9Ac was performed, followed by qPCR analysis on the promoter regions of the known SIRT6 target glycolysis genes. Data indicate mean ± S.D. c & d, Immunofluorescence staining against H3K56Ac and CD34 in DMBA/TPA-treated Sirt6 WT or cKO tumors. More concentrated antibody condition was used in the samples shown in d for H3K56Ac. Scale bars indicate 100μm. e, Glucose uptake was measured after 2-NBDG incubation in SCC13 cells followed by FACSAria II analysis. Data indicate mean ± S.D. Cells were cultured in the presence of doxycycline to induce knockdown of SIRT6, and then either kept in Dox (Dox ON) or withdrew from Dox for 3 days (Dox OFF) f-h, Glucose and lactate concentration, and the ratio of these two were measured in media of SCC13 cells pretreated with doxycycline for 3 days by using kits from Biovision. Data indicate mean ± S.D. i, Glycolysis stress test was performed using the Seahorse bioanalyzer following the manufacturer’s instruction in SCC13 cells pretreated with doxycycline for at least 3 days. ECAR value was normalized by cell number of each well using the Cyquant cell proliferation assay kit. Data indicate mean ± S.D. j, Ratio of NAD+/NADH was assessed by a kit from Abcam in SCC13 cells pretreated with doxycycline for 3 days k, Relative reactive oxygen species level analyzed by LSRII using CellROX deepred in SCC13 cells 3 days post doxycycline. Data indicate mean ± S.D. l & m, Relative abundance of the indicated metabolites either in control (shCtrl) or SIRT6 knockdown (shSIRT6) SCC13 cells 3 days post doxycycline. Data indicate mean. Statistics, sample sizes (n) and numbers of replications are presented in Methods, ‘Statistics and reproducibility’. * p<0.05, ** p<0.01, *** p<0.001

