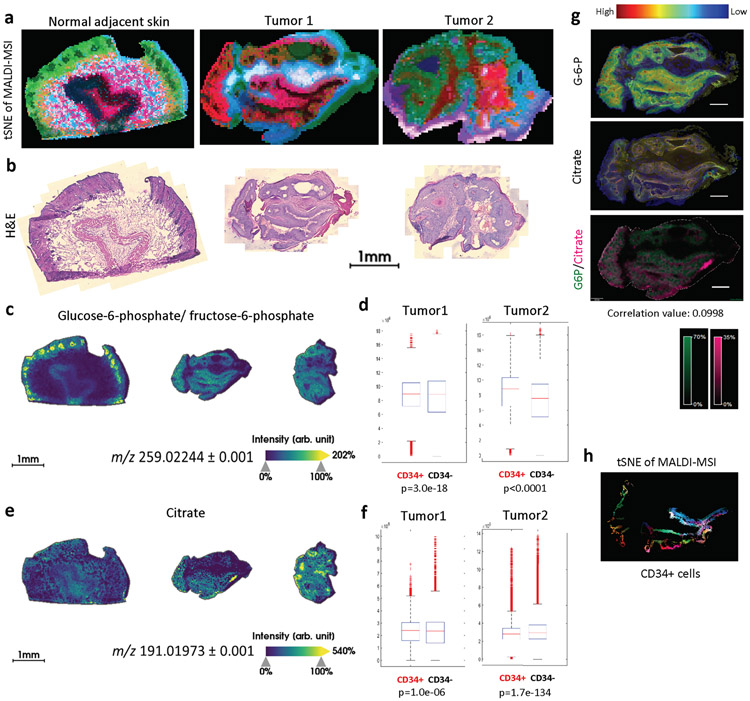
Extended Data Fig. 8. Metabolic heterogeneity within tumors as determined by MALDI-MSI.
Extended Data Figure 8 (related to Fig. 3). a, tSNE analysis of all the metabolites analyzed by MALDI-MSI in each sample. Rainbow spectrum represents how close each pixel to the others is within each sample. There was no input of histological information of tissue to perform this dimensionality reduction. b, H&E staining in the same section as MALDI-MSI. Images were taken at 40x and stitched with the software in Zeiss microscope. Scale bars indicate 1mm. c & e, MALDI-MSI data of glucose-6-phosphate and citrate in DMBA/TPA-treated tumors and adjacent skin Scale bars indicate 1mm. d & f, Quantification of MALDI-MSI signal intensity of each metabolite from CD34+ and CD34− areas g, Co-registration images (the left two) of G-6-P and citrate on top of immunofluorescence stained image in tumor 1. Overlay image (the very right) of G-6-P and citrate with a correlation value of distribution between two metabolites. Scale bars indicate 300μm. h, tSNE analysis of CD34+ area in tumor 1. Statistics, sample sizes (n) and numbers of replications are presented in Methods, ‘Statistics and reproducibility’.

