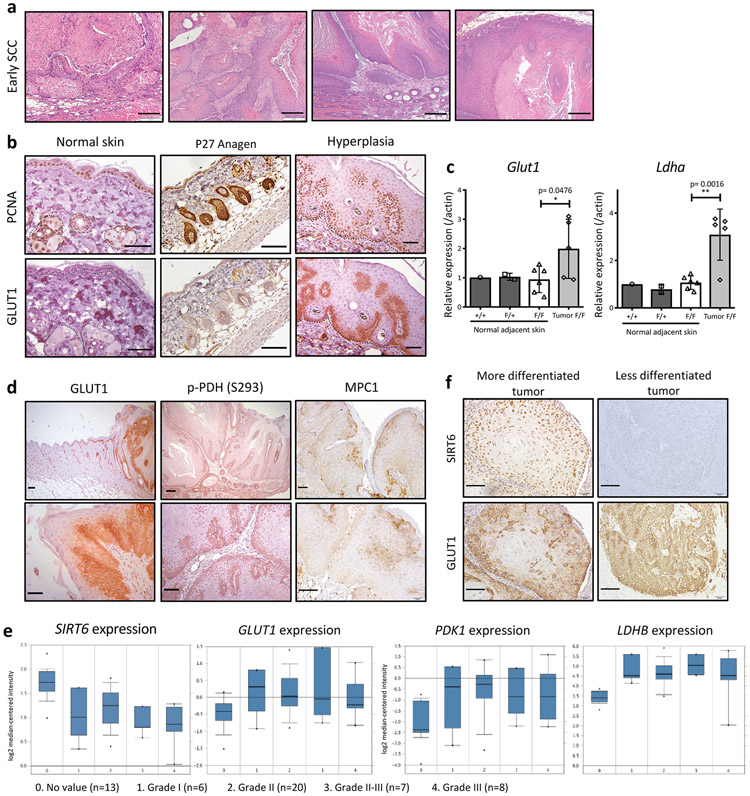
Extended Data Fig. 2. Dysplastic cancer cells presented increased glycolysis in an in vivo model of cutaneous SCC and in human HNSCC in the context of SIRT6.
Extended Data Figure 2 (related to Fig. 1)a, H&E stained images of early SCC found only among Sirt6 cKO tumors. Scale bars indicate 200μm b, PCNA (top) and GLUT1 (bottom) immunostaining in normal untreated skin, P27 anagen animal back skin, and dysplastic skin treated with DMBA/TPA. Dashed line indicates either hair follicle or epidermis. For normal skin, both images came from the same untreated mouse, but not immediate adjacent skin sections. Scale bars indicate 100μm. c, Glut1 and Ldha expression in normal skin and skin tumors from Sirt6-deficient animals at 21 weeks after DMBA treatment. Data indicate mean ± S.E.M. d, GLUT1, phospho-PDH (Ser293), and MPC1 immunostaining in Sirt6-deleted large papilloma samples. Scale bars indicate 100μm. e, SIRT6, GLUT1, PDK1, and LDHB expression levels in human HNSCC compared by tumor grade from Ginos et al. listed in the Oncomine. f, Representative SIRT6 and GLUT1 immunostaining from human differentiated HNSCC and undifferentiated HNSCC. Scale bars indicate 100μm. Statistics, sample sizes (n) and numbers of replications are presented in Methods, ‘Statistics and reproducibility’. * p<0.05 ** p<0.01

