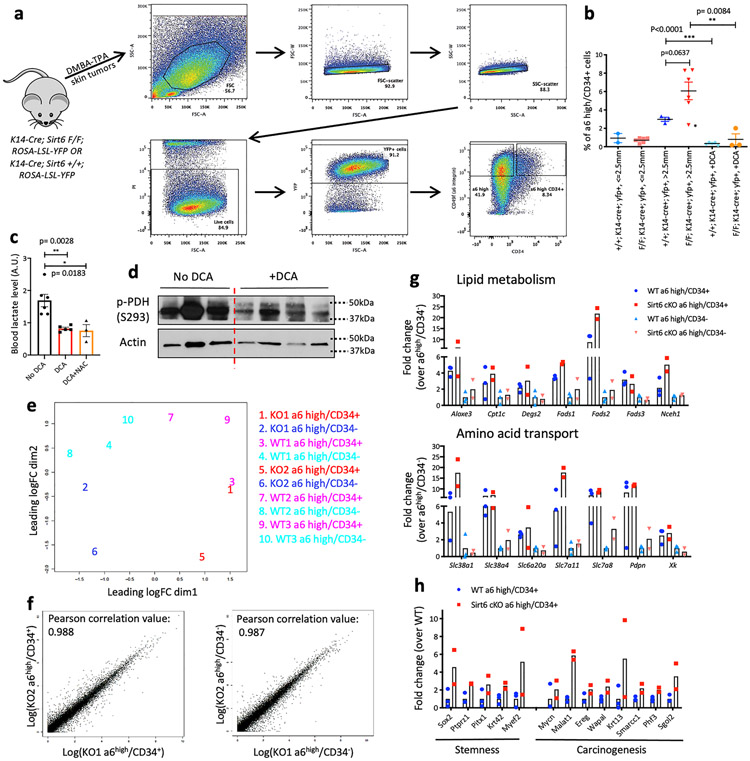
Extended Data Fig. 4. Analysis of tumor-propagating cell enrichment and transcriptome.
Extended Data Figure 4 (related to Fig. 2). a, Representative flow sorting scheme from mouse skin tumors to isolate α6 integrinhigh/CD34+ cells in FACSAria II b, Percentage of α6 integrinhigh/CD34+ cells from Sirt6 WT or Sirt6-deleted skin tumors with or without DCA treatment. Skin tumors were grouped based on their tumor size and genotype for comparison. In the group of skin tumors bigger than 2.5mm from Sirt6 F/F; K14-cre+; YFP+ animals, if we exclude the lowest value from the group (marked with a star sign), the difference in the enrichment α6 integrinhigh/CD34+ cells between Sirt6 WT and Sirt6-deleted skin tumors that were bigger than 2.5mm becomes statistically significant (** p=0.0086) Data indicate mean ± S.E.M. c, Blood (from tail vein) lactate level assessed by GC-MS in DCA-treated animals and control animals Data indicate mean ± S.E.M. d, Western blot analysis of p-PDH (Ser293) from DCA-treated skin samples and vehicle control. e, An MDS plot of all the samples with top 500 DEGs f, Correlation plots between biological duplicates of KO tumor subpopulations g, Representative gene list and corresponding fold changes in expression from Sirt6 WT or cKO TPCs and its negative counterparts (α6high/CD34−) for functional gene categories associated with lipid metabolism (top) and amino acid transport (bottom). Data indicate mean. h, Representative gene list and corresponding fold changes in expression from Sirt6 WT or cKO TPCs for functional gene categories associated with each biological process. Data indicate mean. Statistics, sample sizes (n) and numbers of replications are presented in Methods, ‘Statistics and reproducibility’. * p<0.05 ** p<0.01 *** p<0.0001

