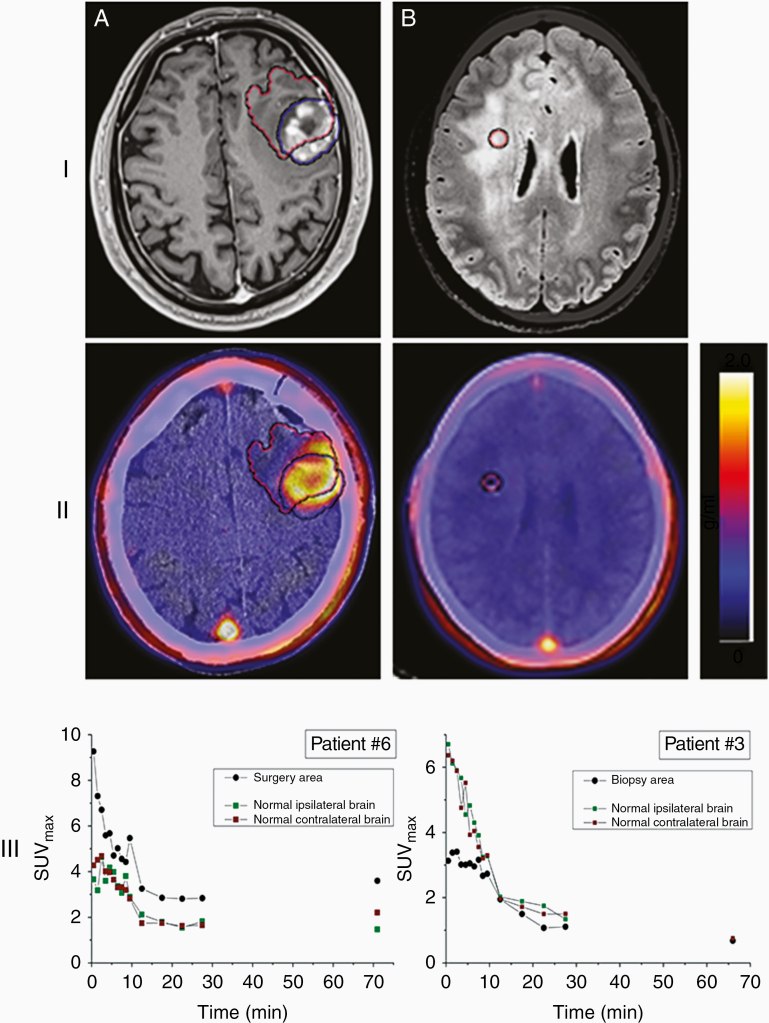
Figure 1.
[18F]-FDHT uptake in high-grade gliomas. (I) MRI and (II) PET (registered with post-op CT/MRI) transaxial slices showing (A) high (patient #6), and (B) no (patient #3, gliomatosis cerebri) [18F]-FDHT uptake on static PET images acquired about 60 min after radiopharmaceutical injection. Blue and red VOIs represent respectively the tumor and biopsy/surgery area on MRI and PET slices. (III) Time-activity curves in terms of SUVmax corresponding to the biopsy/surgery area and normal ipsi- and contralateral brain. The color scale next to each PET image represents the SUV in units of g/mL.

