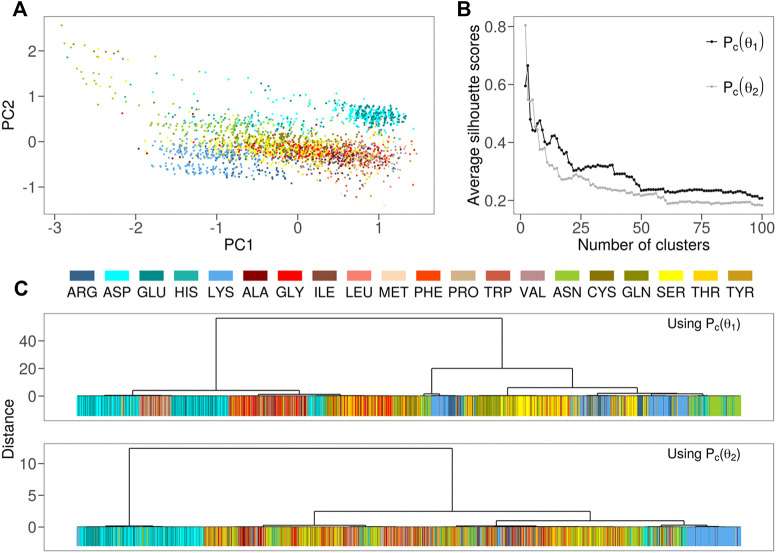
FIGURE 3.
(A) Projection along the first two principal components of the residues in the Protein dataset as obtained by a PCA analysis using , , and as descriptors for each residue. Each dot in the plane represents a residue, with different colors corresponding to different amino acids (B) Cluster of the residue forming the Protein dataset using the (top) or (bottom) as descriptors for each residue (C) Average silhouette score as a function of the number of clusters considered in (B).

