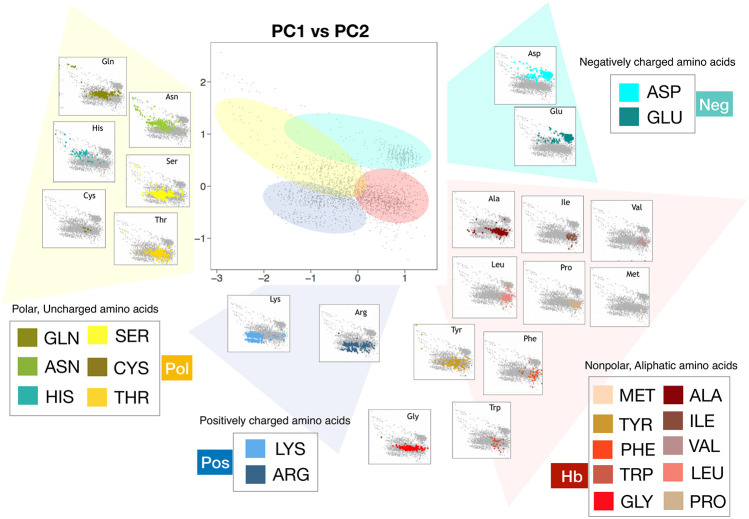
FIGURE 4.
Representations in the plane identified by the first and second principal components of all the residues comprising the 20 proteins of the Protein dataset (grey dots). The PCA analysis has been carried out using for each residue the observed , , and computed as described in the Methods. In each panel, dots corresponding to the same kind of amino acid are highlighted with different colors.

