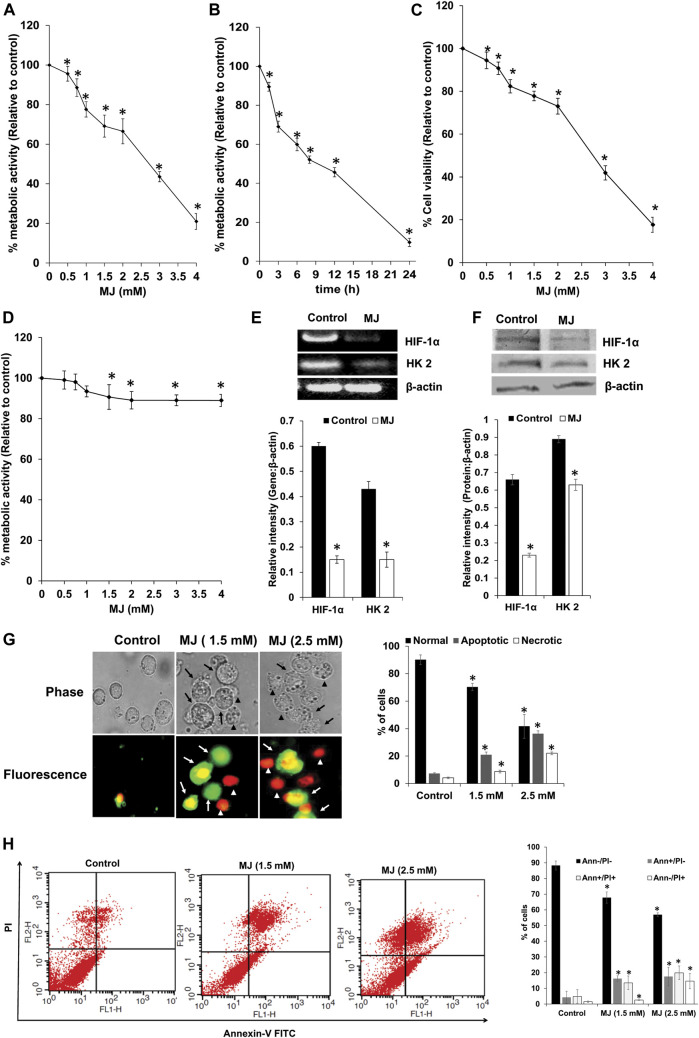
FIGURE 2.
Effect of MJ on tumor cell metabolic activity, expression of metabolic molecules, tumor cell survival, apoptosis, and cytokine repertoire. Tumor cells (1 × 10⁵ cells/ml) were incubated in medium alone or containing the indicated concentrations of MJ (A) for 18 h or in medium with 2.5 mM MJ for the indicated time durations followed by estimation of metabolic activity (A,B), and cell survival (C) as described in the materials and methods. Thymocytes (1 × 10⁵ cells/ml) were incubated in medium with or without the indicated concentration of MJ for 18 h, followed by estimation of metabolic activity (D). Cell lysates of control and MJ-treated (2.5 mM) tumor cells (1 × 10⁵ cells/ml) were examined for gene and protein expression of the indicated metabolic molecules by RT-PCR and western blotting, respectively. Bands shown are from a representative experiment out of three independent experiments with a similar pattern. The accompanying bar diagrams are the densitometry analysis of the bands (E,F). Tumor cells (1 × 10⁵ cells/ml) were incubated in medium alone or containing the indicated concentration of MJ for 18 h followed by estimation of cell death by fluorescence microscopy (G) and flow cytometry (H), as described in the materials and methods. Arrows and arrowheads indicate apoptotic and necrotic cells, respectively in the microscopic images. Flow cytometric and microscopic fluorescence images are from a representative experiment out of three independent experiments with a similar pattern. Values shown are bar diagrams are mean ± SD of three independent experiments. *p < 0.05 vs. respective control.

