FIGURE 3.
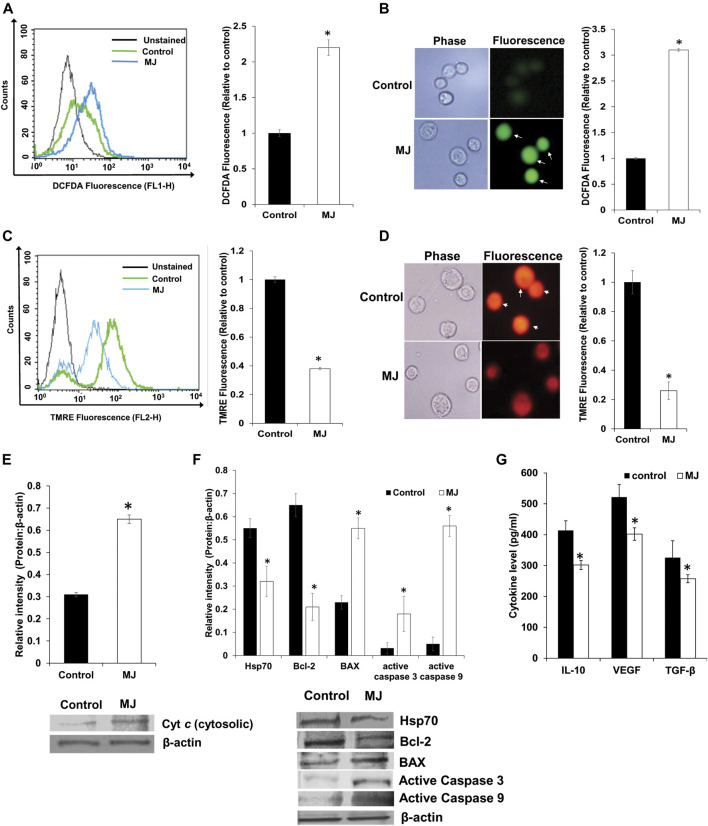
Effect of MJ on the expression of ROS, mitochondrial membrane potential and expression of cytosolic Cyt c and cell survival regulatory molecules. Tumor cells (1 × 10⁵ cells/ml) were incubated in medium alone or containing MJ (2.5 mM) for 2 h, followed by estimation of ROS expression by flow cytometry (A) and fluorescence microscopy (B). The mitochondrial membrane potential was estimated following 4 h of MJ (2.5 mM) treatment by flow cytometry (C) and fluorescence microscopy (D). The cytosolic fraction of the control and MJ (2.5 mM) treated tumor cells (1 × 10⁵ cells/ml) following 18 h of incubation in the respective treatments were analyzed for the Cyt c by Western blotting (E). The flow cytometric (A,C), fluorescence microscopic (B,D), and Western blotting (E) images are from a representative experiment out of three independent experiments with a similar pattern. Arrows indicate cells positive for DCFDA (B) and TMRE staining (D), respectively. Accompanying bar diagrams (A–E) are mean ± SD of quantitative values of the flow cytometric analysis and densitometry of fluorescence, and Western blots, respectively. *p < 0.05 vs. respective control. Tumor cells (1 × 10⁵ cells/ml) of control and MJ-treated (2.5 mM) groups were also analyzed for the expression of the indicated cell survival regulatory proteins by Western blotting as described in the materials and methods (F). Bands (F) shown are from a representative experiment out of three independent experiments with a similar pattern. The accompanying bar diagrams are the densitometry analysis of the bands (F). Tumor cells (1 × 10⁵ cell/ml) were incubated in medium alone or containing MJ (2.5 mM) for 18 h followed by estimation of the indicated cytokines in the culture supernatant by ELISA (G) as described in the materials and methods. Values shown are bar diagrams are mean ± SD of three independent experiments. *p < 0.05 vs. respective control. Values shown are mean ± SD *p < 0.05 vs. respective control.

