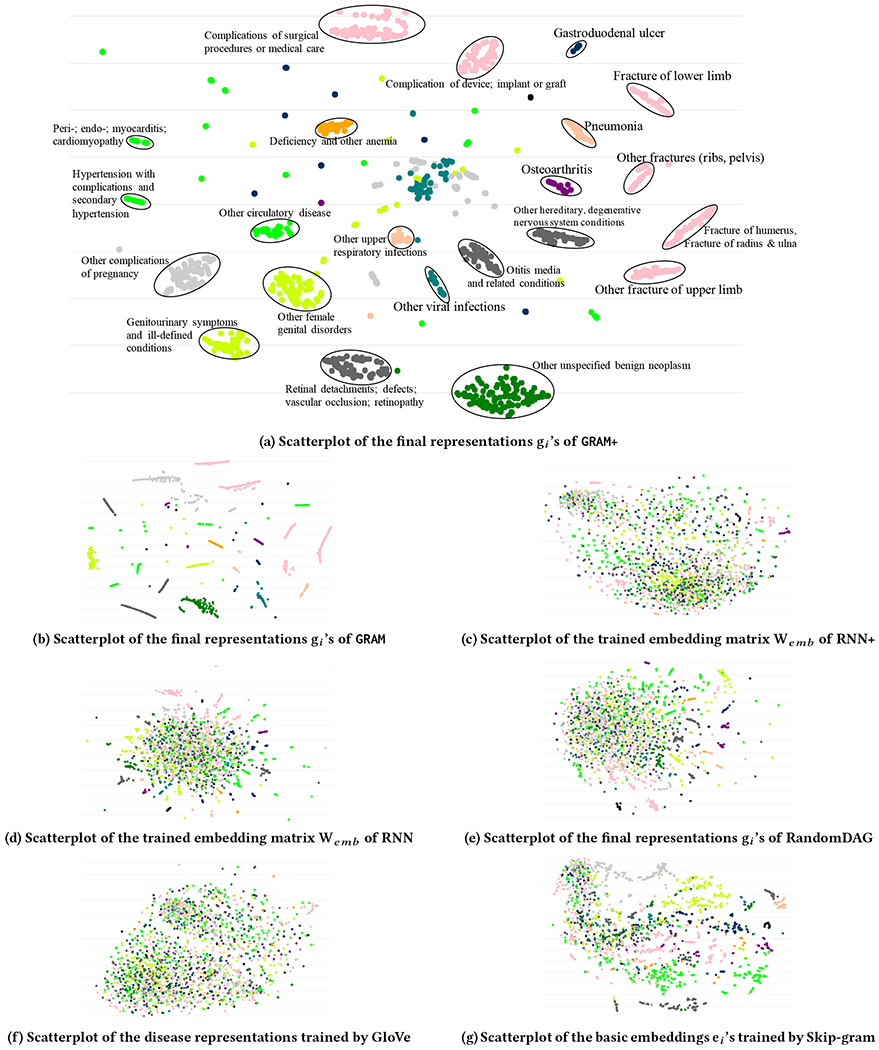
Figure 3:

t-SNE scatterplots of medical concepts trained by GRAM+, GRAM, RNN+, RNN, RandomDAG, GloVe and Skip-gram. The color of the dots represents the highest disease categories and the text annotations represent the detailed disease categories in CCS multi-level hierarchy. It is clear that GRAM+ and GRAM exhibit interpretable embedding that are well aligned with the medical ontology.
