
Figure 4:
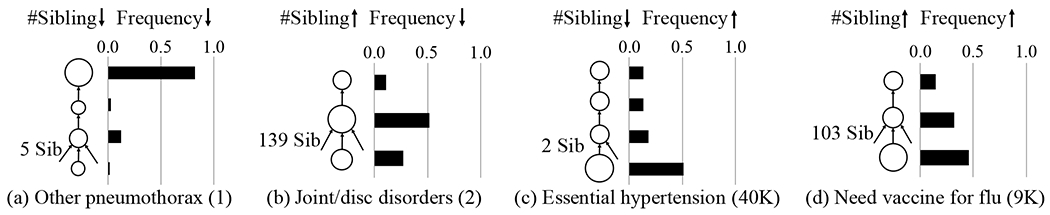
GRAM’s attention behavior during HF prediction for four representative diseases (each column). In each figure, the leaf node represents the disease and upper nodes are its ancestors. The size of the node shows the amount of attention it receives, which is also shown by the bar charts. The number in the parenthesis next to the disease is its frequency in the training data. We exclude the root of the knowledge DAG from all figures as it did not play a significant role.