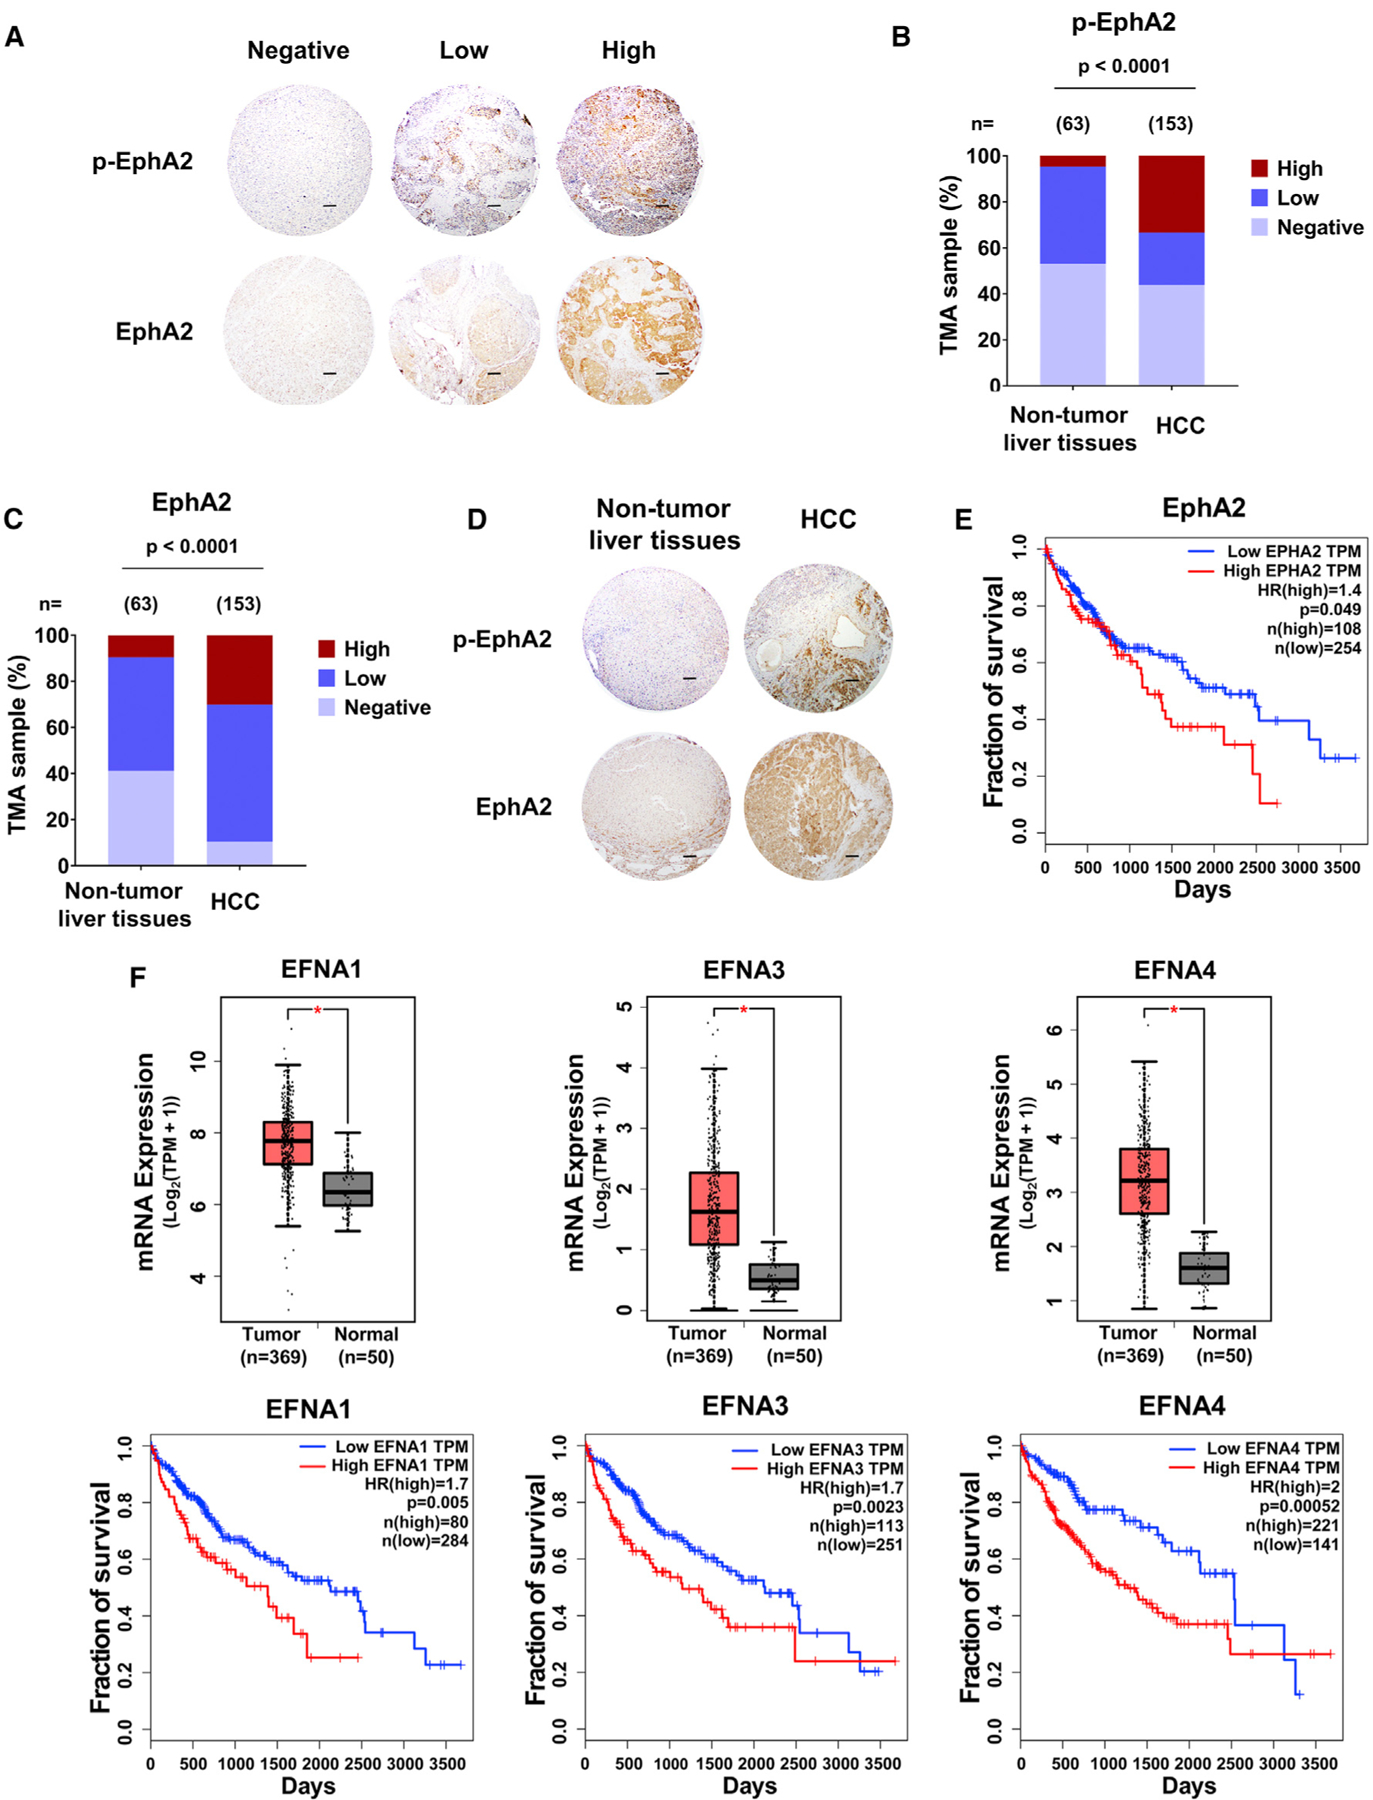
Figure 1. High EphA2 signaling and expression is detected in HCC patient samples and is associated with poor prognosis.

(A) Representative IHC images of Y588 p-EphA2 and total EphA2 in HCC tissue microarray classified as negative, low, or high expression. Scale bars, 100 μm.
(B) Y588 p-EphA2 expression levels in TMAs of normal and HCC liver samples.
(C) Total EphA2 expression levels in TMAs of normal and HCC liver samples.
(D) Representative examples of normal versus HCC TMAs measured in (B) and (C). Scale bars, 100 μm.
(E) Kaplan-Meier plot of overall survival of HCC patients stratified by EphA2 expression levels from the TCGA database (GEPIA).
(F) Top: a boxplot of relative mRNA expression levels of EFNAs comparing normal versus HCC tissue. Bottom: Kaplan-Meier plot of overall survival of HCC patients stratified by EFNA expression levels. Data from TCGA (GEPIA).
Statistical significance was determined by chi-square test (B) and (C), two-tailed Student’s t test *p < 0.0001 boxplots (F), and log-rank test Kaplan-Meier plot (E and F).
