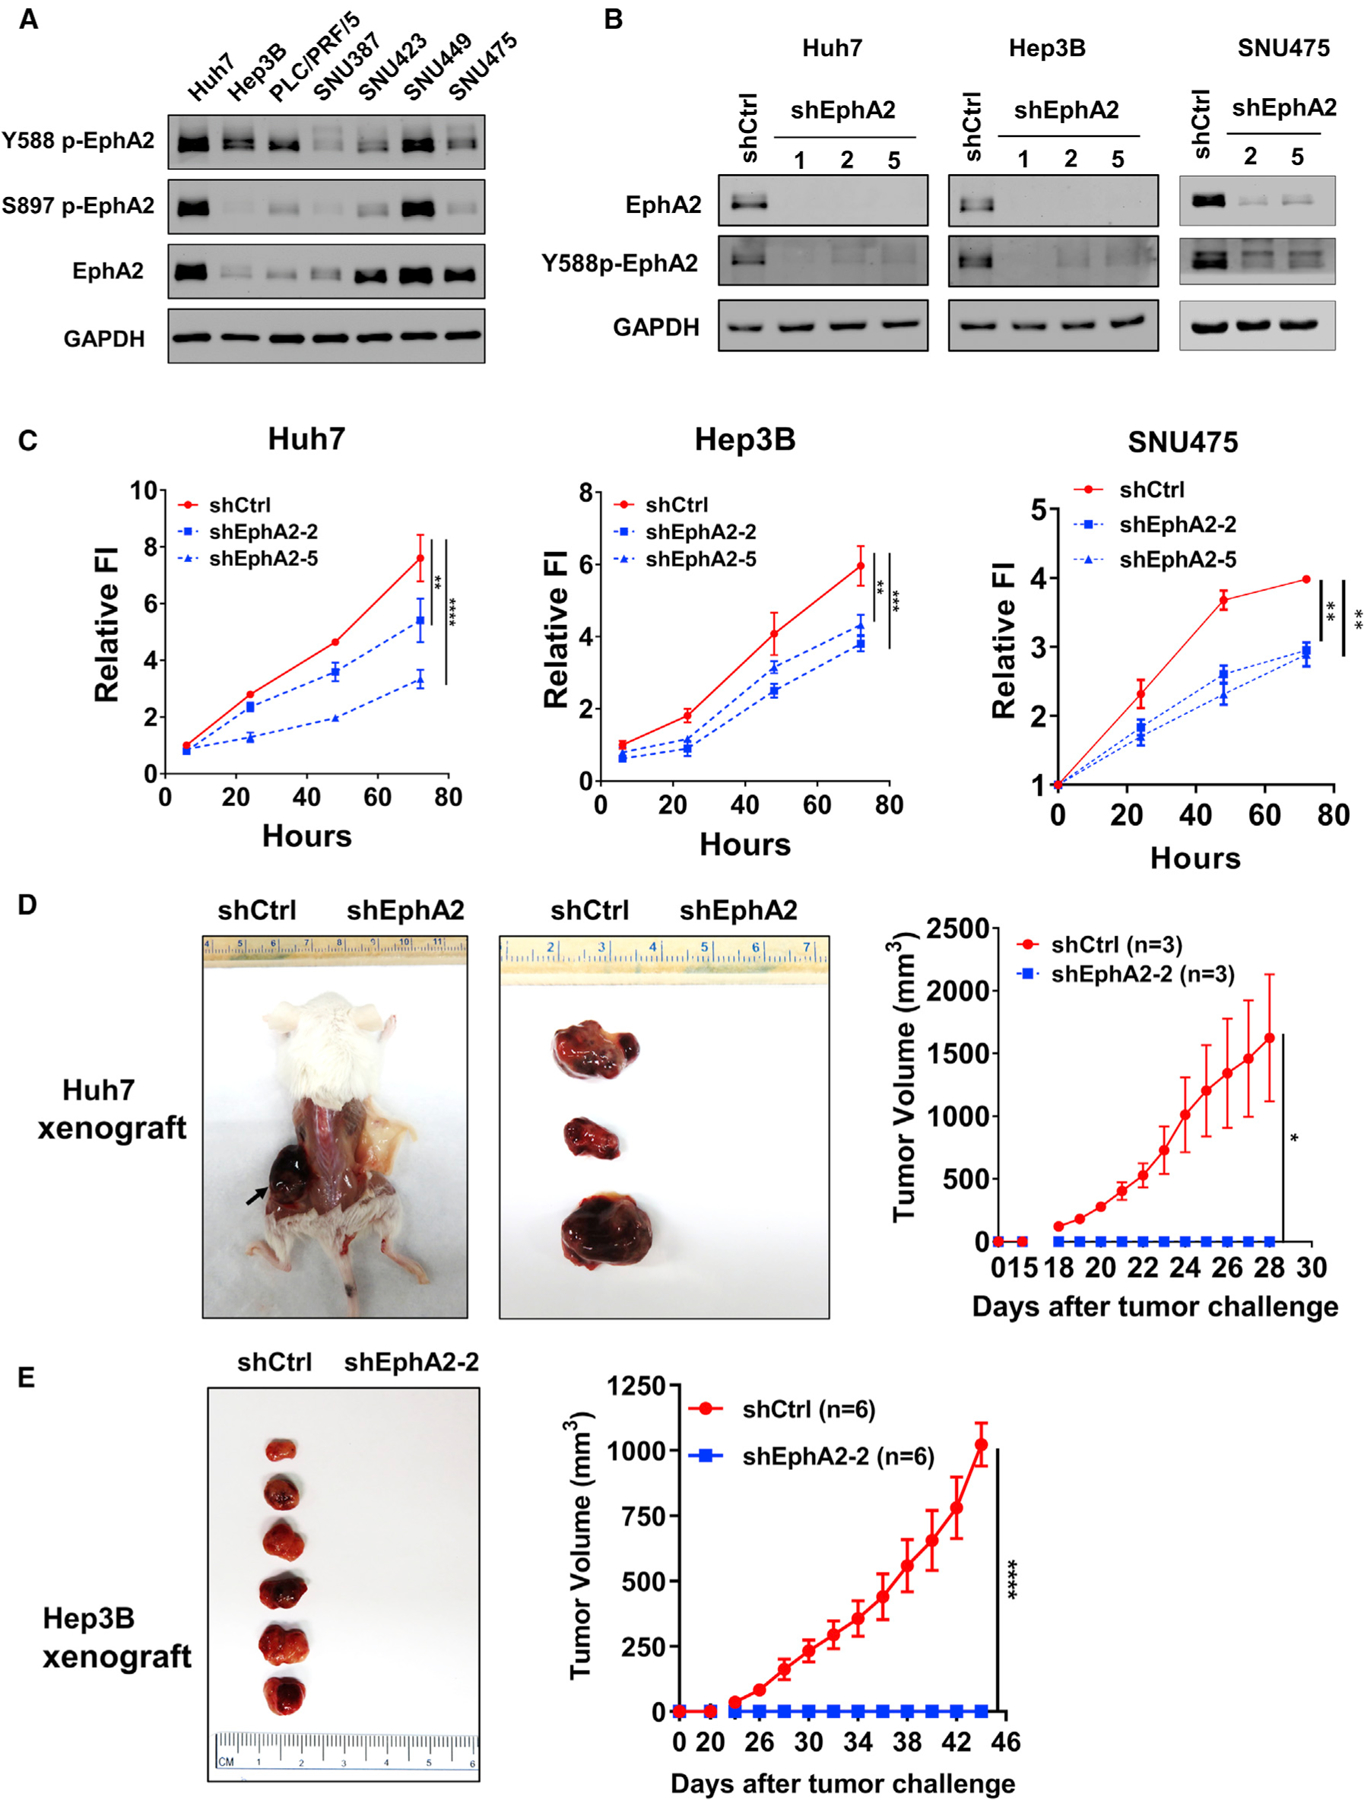
Figure 2. EphA2 drives HCC tumor proliferation and initiation.

(A) Western blot showed EphA2 activation in 7 independent HCC cell lines. GAPDH as a loading control.
(B) Western blot validated EphA2 knockdown efficiency after lentiviral transduction of 3 independent EphA2 shRNAs 7 days after puromycin selection.
(C) Cell proliferation studies of control versus EphA2 knockdown Huh7, Hep3B, and SNU475 cells at day 7 after puromycin selection. Cell proliferation was evaluated using the Alamar blue assay. The ratio of proliferation is normalized to at 6 h after initial seeding of the cells and measured at 24, 48, and 72 h. Values are mean ± SD (n = 4).
(D) Left: representative picture of NSG-A2 mice 28 days after injection with 3 × 10⁶ Huh7 cells. Left flank: shCtrl. Right flank: shEphA2. N = 3 mice per group. Right, daily measurements of primary tumor size. Values are mean ± SEM.
(E) Left: representative picture of NSG-A2 mice 44 days after injection with 3 × 10⁶ Hep3B cells. Left flank: shCtrl. Right flank: shEphA2. N = 6 mice per group. Right, daily measurements of primary tumor size. Values are mean ± SEM.
Statistical significance was determined by one-ANOVA analysis with Dunnett’s multiple comparisons test (C) or two-tailed Student’s t test (D and E); *p < 0.05, **p < 0.01, ***p < 0.001 and ****p < 0.0001.
