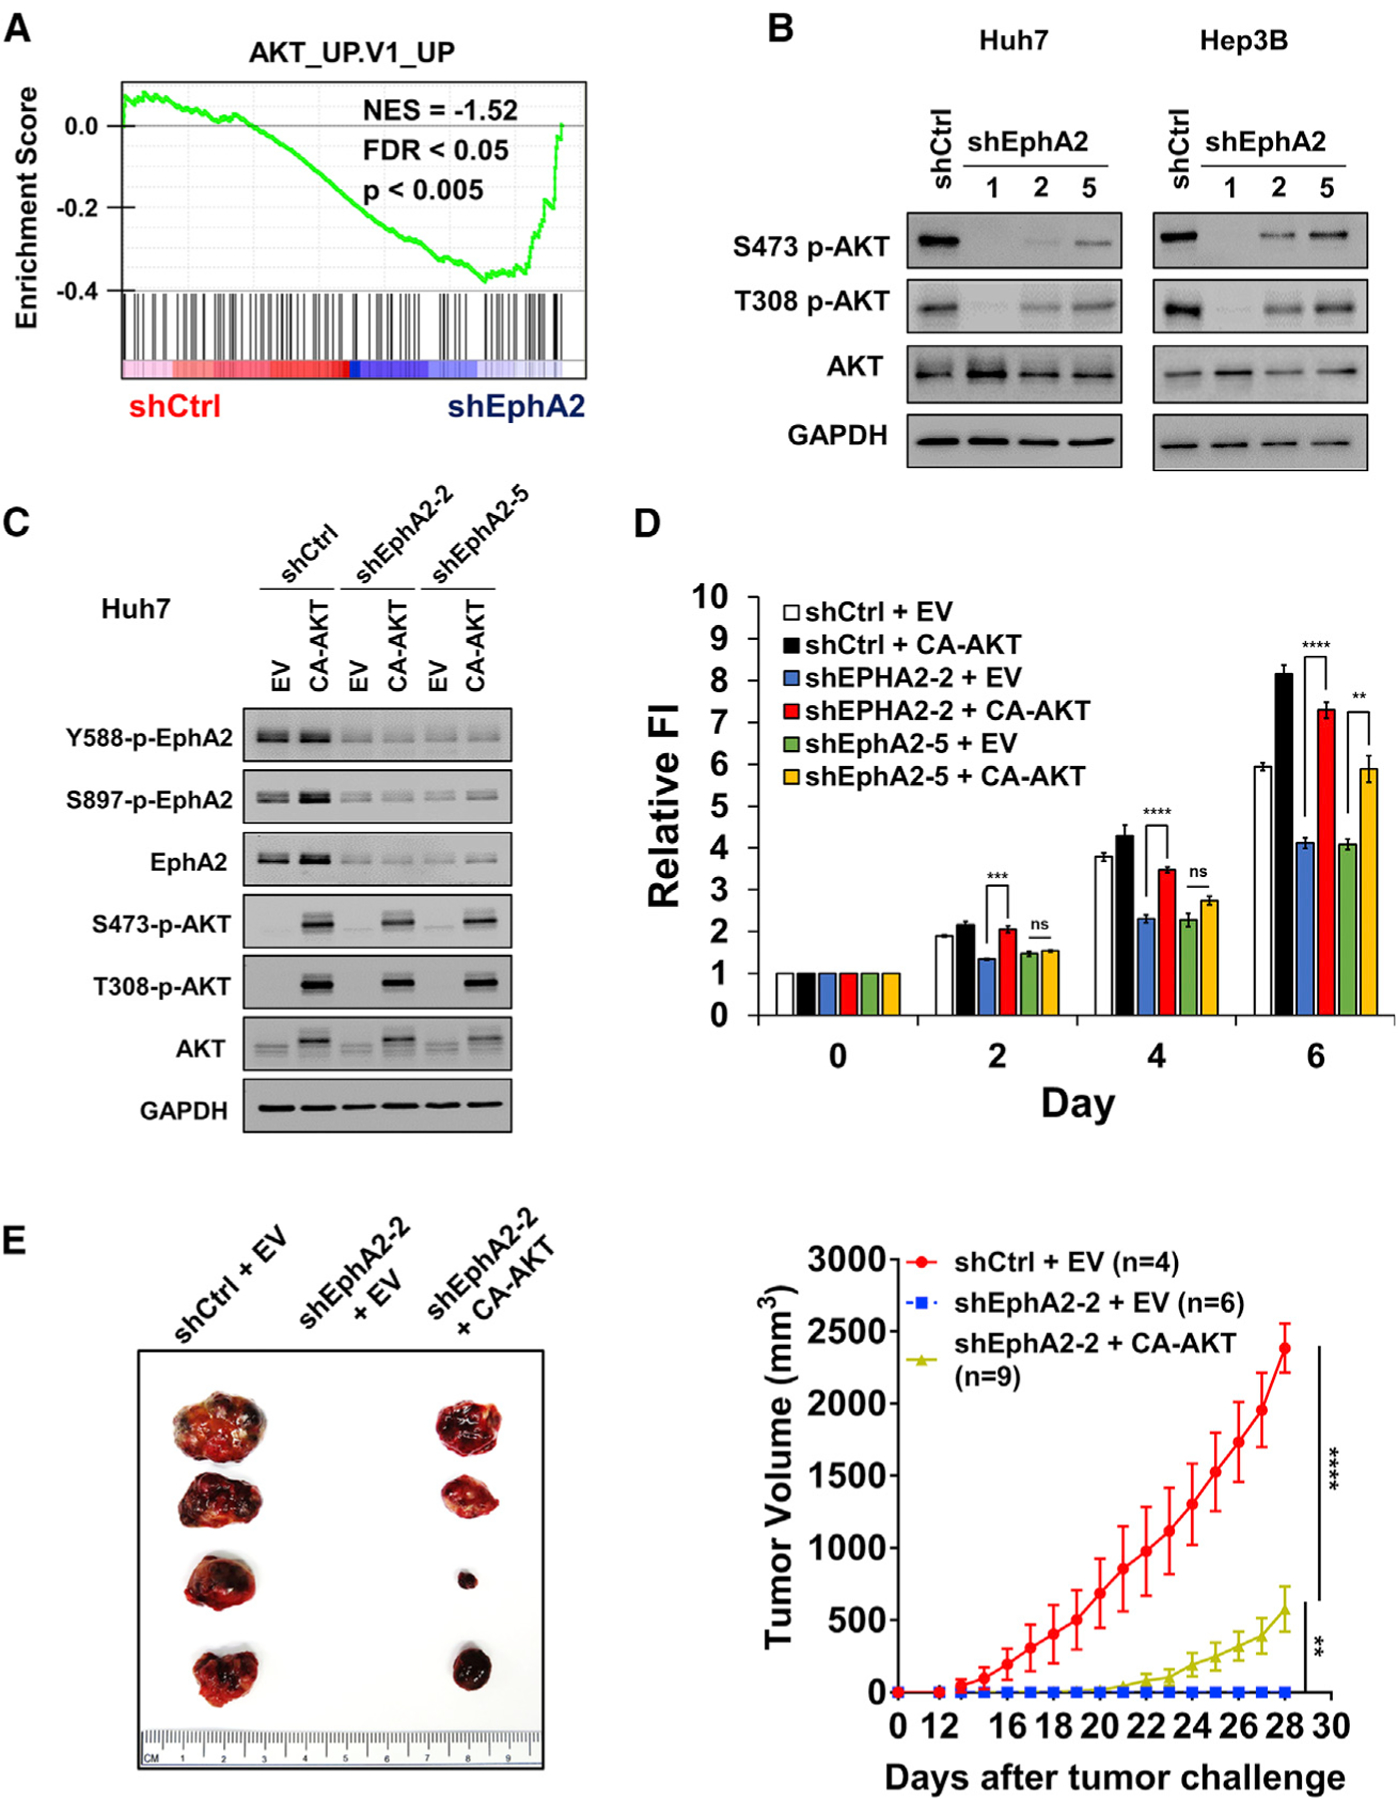
Figure 4. EphA2 promotes the initiation and growth of HCC partially through activation of the AKT pathway.

(A) GSEA revealed that genes in the AKT pathway are highly enriched in EphA2 knockdown Huh7 cells.
(B) Cell lysate of EphA2 knockdown Huh7 and Hep3B cells were immunoblotted for p-AKT and total AKT. GAPDH as a loading control.
(C) Western blot validated overexpression of constitutively active AKT (CA-AKT) in the context of two independent shRNA mediated EphA2 knockdown in Huh7 cells.
(D) Cell proliferation study was conducted using cells described in (C) using the Alamar blue assay. Fluorescence intensity was measured at day 0 (6 h after seeding) and subsequently at day 2, 4, and 6. Values are mean ± SD (n = 4).
(E) Left: representative picture of tumors extracted from NSG-A2 mice 28 days after subcutaneous injection with cells described in (C) and (D). n = 4, 6, 9 mice in shCtrl + EV, shEphA2 + EV, and shEphA2 + CA-AKT, respectively. Right: daily measurements of primary tumor size. Values are mean ± SEM.
Statistical significance was determined by two-tailed Student’s t test (D) and one-ANOVA analysis with Dunnett’s multiple comparisons test (E) **p < 0.01, ***p < 0.001 and ****p < 0.0001.
