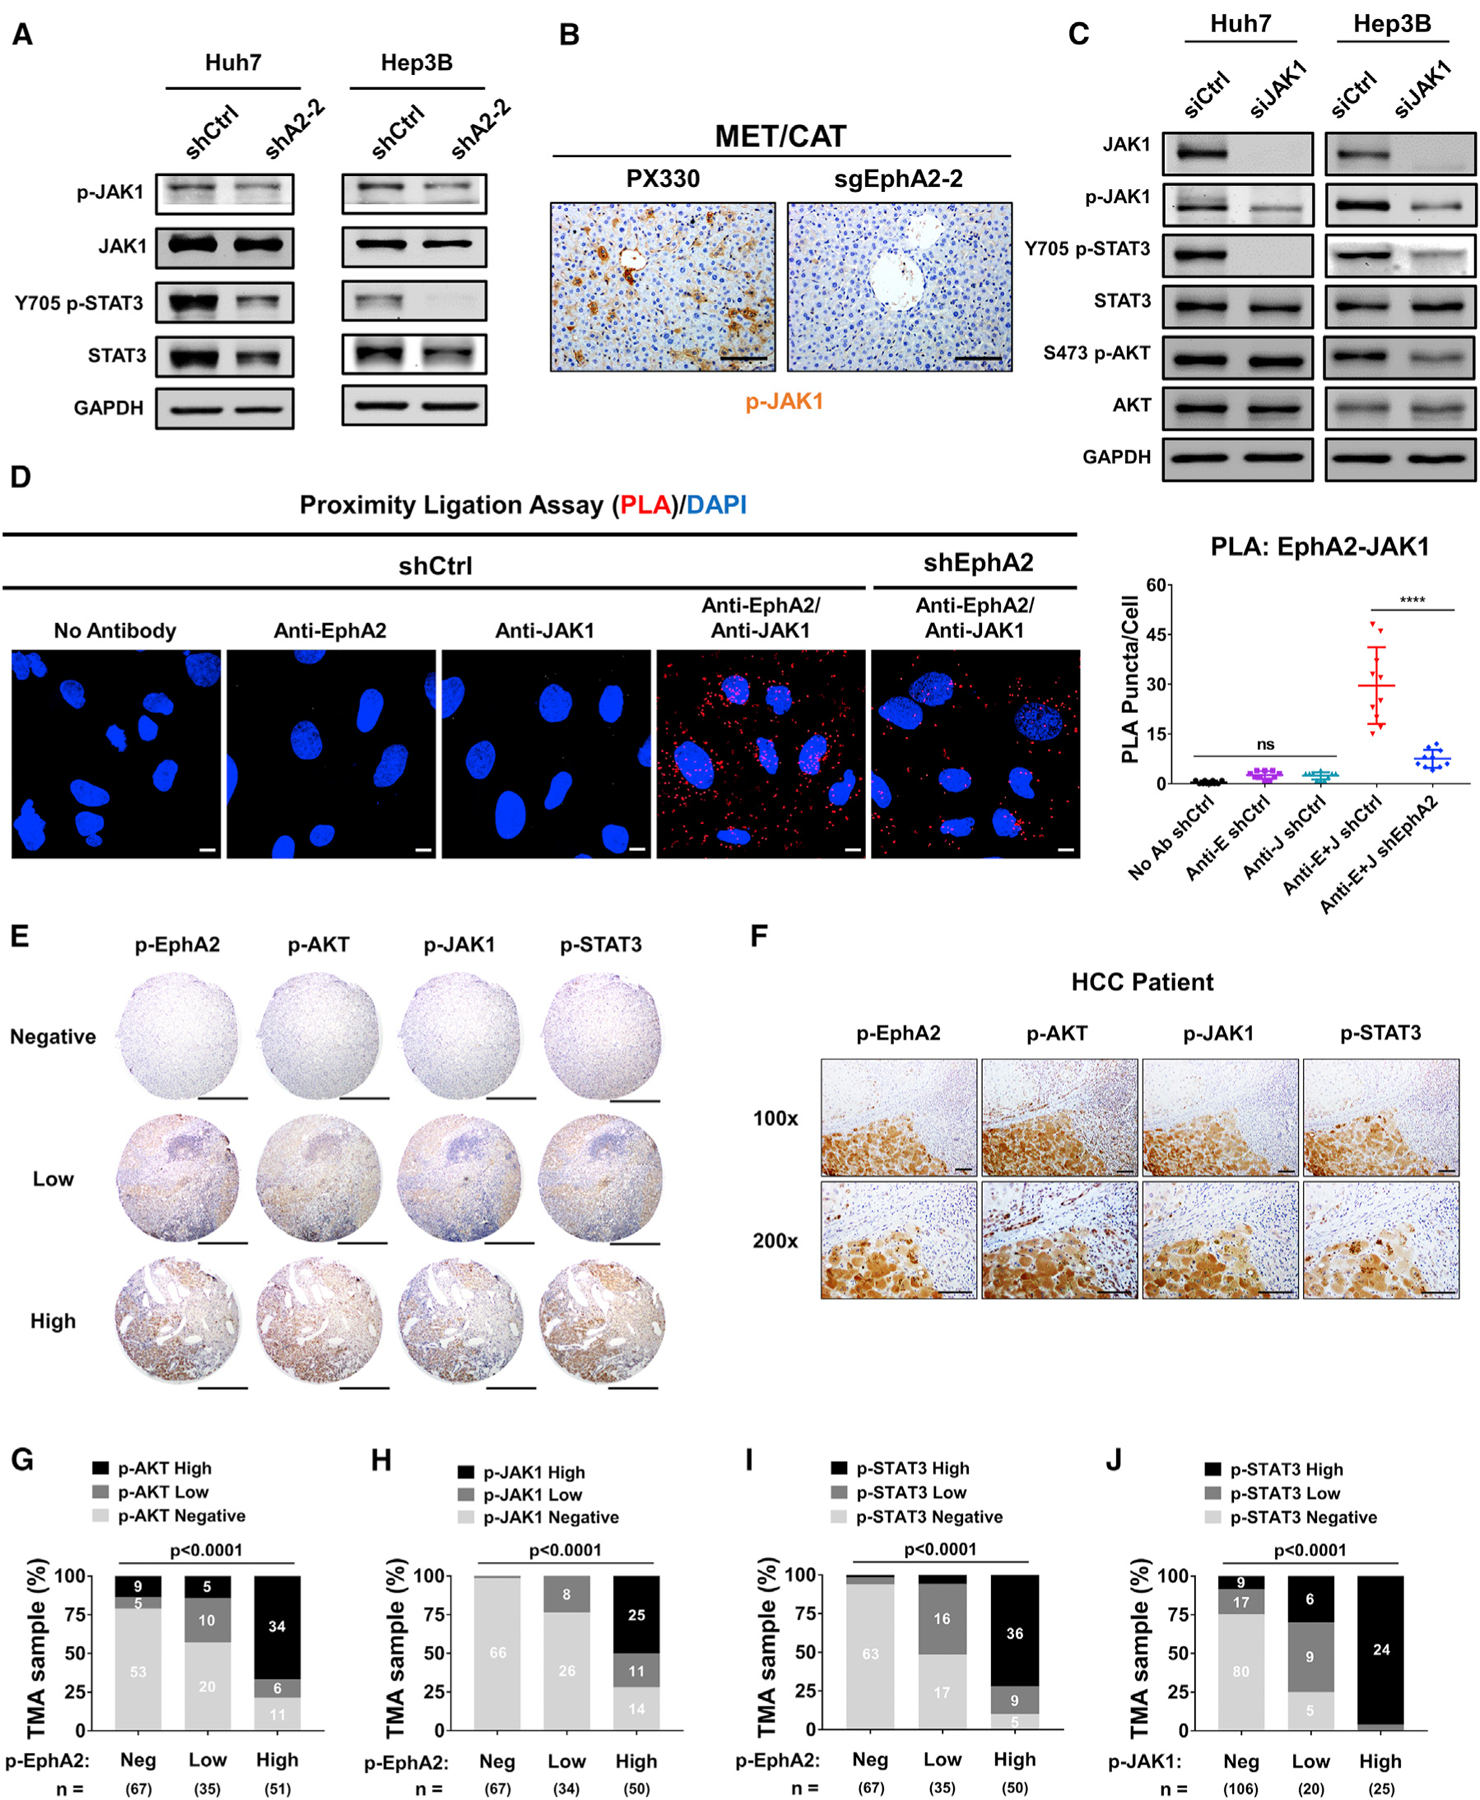
Figure 6. EphA2 activates STAT3 signaling via JAK1 in HCC, and EphA2 signaling is positively correlated with AKT and JAK1/STAT3 activation in HCC patient samples.

(A) Cell lysate of EphA2 knockdown Huh7 and Hep3B cells were immunoblotted for p-JAK1, JAK1, p-STAT3, and total STAT3. GAPDH as a loading control.
(B) The liver of EphA2 knockout MET/CAT mice was extracted, and IHC was used to assess for p-JAK1 expression comparing to control (PX330). Scale bar, 100 μm.
(C) Huh7 and Hep3B cells were transfected with siRNA targeting JAK1. 48 h after the transfection, the protein was extracted and immunoblotted for JAK1, p-JAK1, p-STAT3, STAT3, p-AKT, and AKT expression.
(D) Left: the interaction of EphA2 and JAK1 was quantified using proximity ligation assay (PLA) in Huh7 scramble (shCtrl) and EphA2 knockdown (shEphA2) cells. Positive PLA interaction (red). Nuclei were stained with DAPI (blue). Scale bar, 10 μm. Right: PLA Puncta per cell was quantified using Imaris Bitplane, n = 10. Statistical significance was determined by one-ANOVA analysis with Tukey’s multiple comparisons test (D). ns, not significant; *p < 0.05, ****p < 0.0001.
(E) Representative immunohistochemistry (IHC) images and correlation of Y588 p-EphA2, p-AKT, p-JAK1, and p-STAT3 in HCC tissue microarray classified as negative, low, or high expression. Scale bars, 500 μm.
(F) Representative high-power magnification of IHC images of HCC showing a correlation between Y588 p-EphA2, p-AKT, p-JAK1, and p-STAT3. Scale bar, 100 μm.
(G–J) Correlation analysis of all HCC TMA tissues between Y588 p-EphA2 and p-AKT (C), p-EphA2 and p-JAK1 (D), Y588 p-EphA2 and p-STAT3 (E), and p-JAK1 and p-STAT3. Statistical significance was determined by a chi-square test (C–F).
