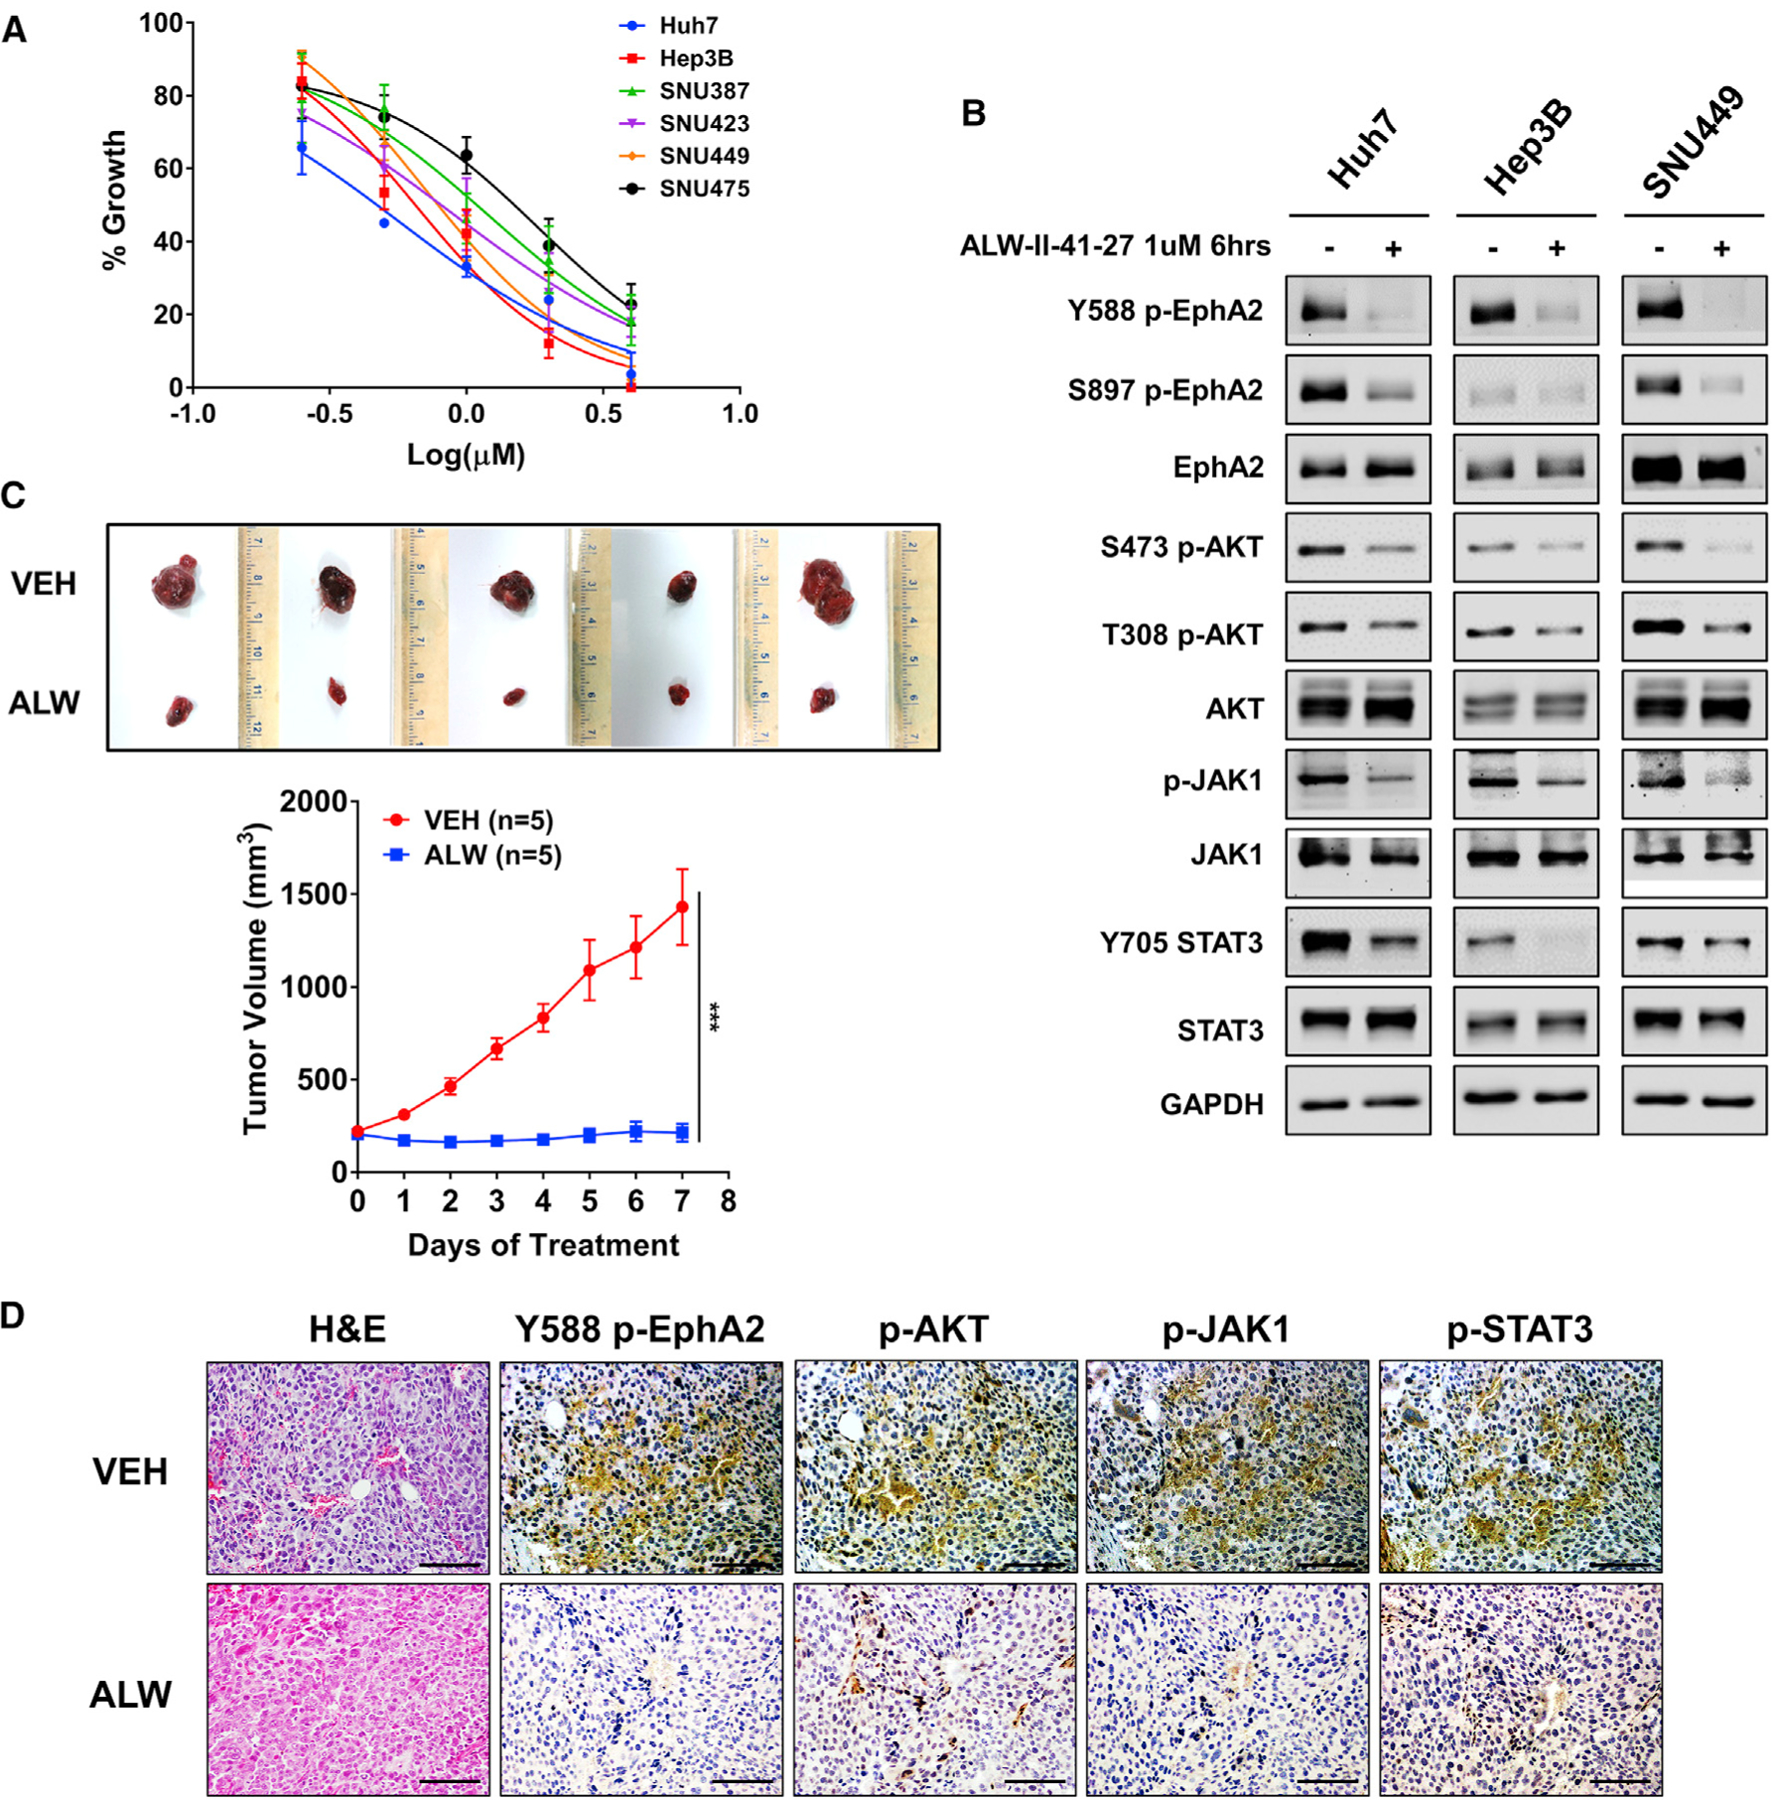
Figure 7. Pharmacologic targeting of EphA2 impairs growth and progression of HCC in vitro and in vivo.

(A) The effect of ALW-II-41–27 on cell proliferation of 6 HCC cell lines was assessed after 48 h of treatment using Alamar blue assay. Data are shown as percent of fluorescence comparing to DMSO control. Values are mean ± SD (n = 4).
(B) Western blot analysis of indicated proteins at the selected time and concentration of ALW-II-41–27 in Huh7, Hep3B, and SNU449 cells. GAPDH as a loading control.
(C) Image of tumors extracted from NSG-A2 mice subcutaneously injected with 5 × 10⁶ Huh7 cells; 7 days after treatment with 15 mg/kg/day ALW-II-41–27 or vehicle. Treatment began after the tumor reached 200 mm3. n = 5 mice per group. Bottom: daily measurements of primary tumor size. Values are mean ± SD. Statistical significance was determined by the two-tailed Student’s t test. ***p < 0.001.
(D) Tumors from mice treated with ALW-II-41–27 or vehicle described in (D) were collected for H&E and assessed for Y588 p-EphA2, p-AKT, p-JAK1, and p-STAT3 expression by IHC. Scale bar 100 μm.
