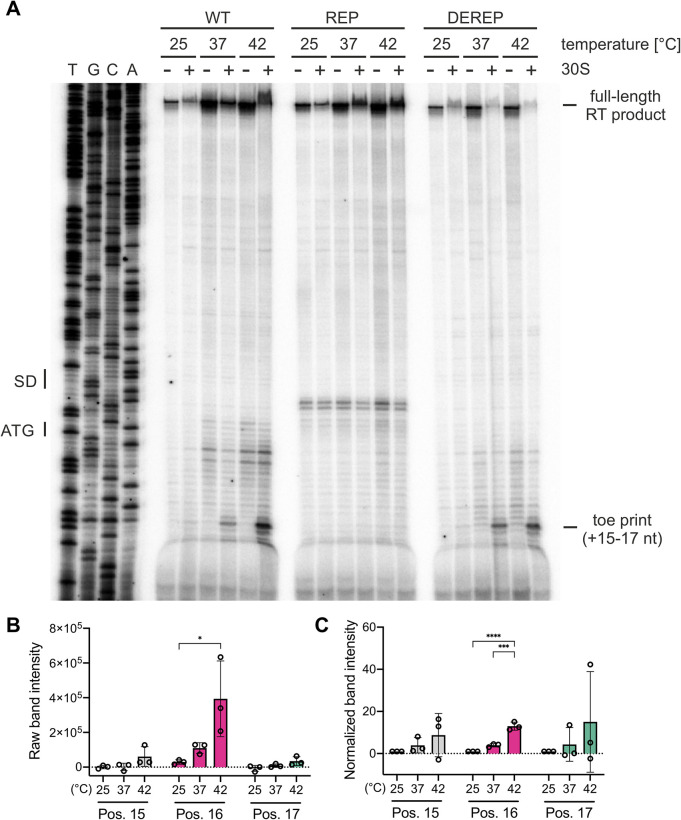
Fig 4. Temperature-dependent binding of ribosomes to the tviA 5’ UTR.
A) Toeprint analysis was performed with in vitro transcribed RNA containing the wildtype tviA 5’ UTR (WT), the rep3 (T90,92C) tviA 5’ UTR mutant (REP), or the derep4 (T89,91;C93G) tviA 5’ UTR mutant (DEREP) at 25, 37, and 42°C, as described in Materials and Methods. TGCA indicates the corresponding DNA sequencing reactions, and the positions of the SD sequence and the ATG start codon are indicated. Reverse transcription reactions were performed without (-) and with (+) the 30S ribosomal subunit. The signals corresponding to the full-length transcript and the toeprint corresponding to the position +15 to +17 from the start codon are indicated. B and C) For toeprint positions +15, +16, and +17, the raw band intensity (B) and normalized band intensity (C) was calculated at each temperature tested for the WT 5’ UTR. For normalization, the band intensity of each position at each temperature was normalized to the average band intensity of that position at 25°C. Data shown are representative of 3 independent experiments. Statistical significance determined using one-way ANOVA with Tukey’s correction. * p < 0.05, *** p < 0.001, **** p < 0.0001.

