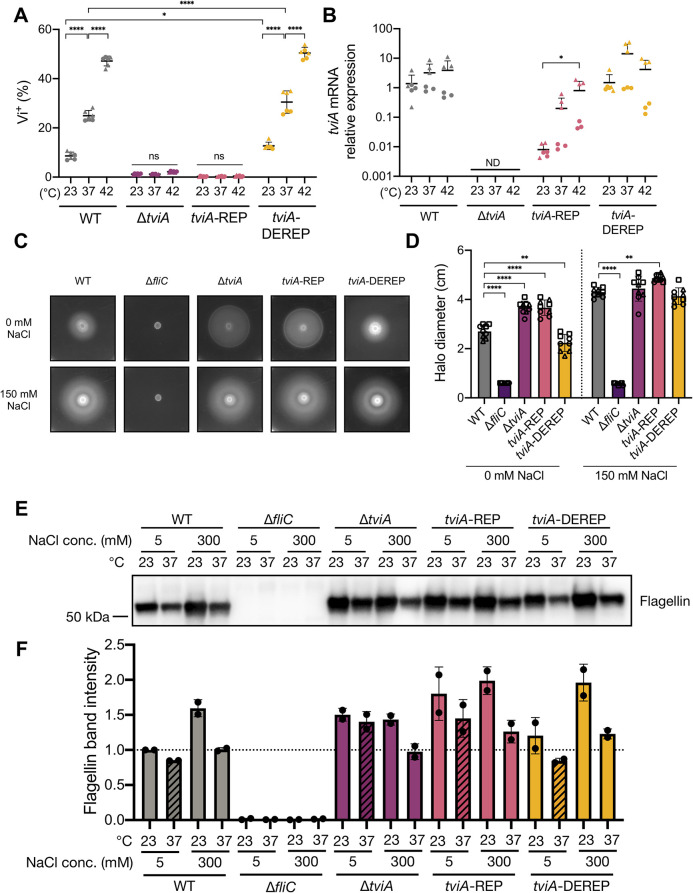
Fig 5. The tviA 5’ UTR fourU RNA thermosensor regulates virulence factor expression in a temperature-dependent manner.
A) Quantitation of Vi capsule expression by flow cytometry of wild-type (WT), ΔtviA, tviA-REP (T90,92C), or tviA-DEREP (T89,91G;C93G) S. Typhi at ambient temperature (23°C) or following a shift to human body temperature (37°C) or fever-like temperature (42°C) for 30 minutes. B) Relative expression levels of tviA mRNA of WT, ΔtviA, tviA-REP, or tviA-DEREP S. Typhi at ambient temperature (23°C) or following a shift to human body temperature (37°C) or fever-like temperature (42°C) for 30 minutes. tviA mRNA levels normalized to 16S rRNA levels for each sample. C) Representative images of WT, ΔfliC, ΔtviA, tviA-REP, or tviA-DEREP S. Typhi grown on motility assay plates (0.3% agar) containing 0 mM or 150 mM NaCl at 37°C for 24 hours. D) Measurement of halo diameter (in cm) of WT, ΔfliC, ΔtviA, tviA-REP, or tviA-DEREP S. Typhi grown on motility assay plates as described in 5C. E) Western blot for flagellin from whole cell lysates of WT, ΔfliC, ΔtviA, tviA-REP, or tviA-DEREP S. Typhi grown for 24 hours statically under the following conditions: low salt media (5 mM NaCl LB broth) at 23°C, low salt media at 37°C, high salt media (300 mM NaCl LB broth) at 23°C, or high salt media at 37°C. F) Quantitation of flagellin from Western blots. Flagellin band intensities were normalized to total protein band intensities for each sample. These values were then further normalized against the “WT low salt 23°C” sample for the purposes of plotting the data. The quantitation results from two independent Western blots are shown. Data shown are combined from 2 (A, B, and F) or 3 (D) independent experiments with triplicate samples for each condition or representative of 2 (E) or 3 (C) independent experiments. Symbol shape corresponds with different independent experiments. Data are represented as mean ± SD. ND, not detected. NS, not significant. Significance calculated using one-way (B and D) or two-way (A) ANOVA with Tukey’s correction. * p < 0.05, ** p < 0.01, **** p < 0.0001.

