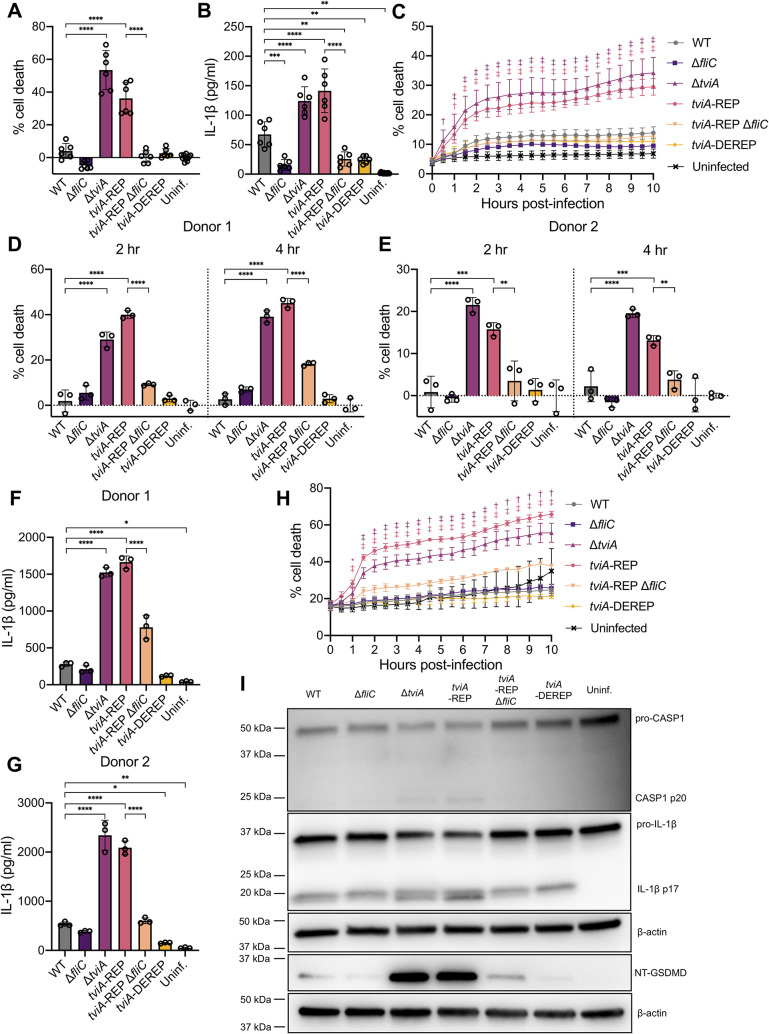
Fig 7. The tviA 5’ UTR fourU RNA thermosensor enables S. Typhi to evade inflammasome activation during infection of human macrophages.
A) Pyroptotic cell death as measured by lactate dehydrogenase release from the human macrophage-like cell line THP1 primed overnight with 100 ng/ml LPS and following infection for 2 hours with WT, ΔfliC, ΔtviA, tviA-REP, tviA-REP ΔfliC, or tviA-DEREP S. Typhi at MOI = 10 or left uninfected. B) Corresponding release of IL-1β to infection described in 7A. C) Kinetics of THP1 cell death as measured by SYTOX Green positive staining on an IncuCyte S3 after overnight priming with 100 ng/ml LPS and infection with WT, ΔfliC, ΔtviA, tviA-REP, tviA-REP ΔfliC, or tviA-DEREP S. Typhi at MOI = 10 or left uninfected. Symbols indicate statistical comparison of ΔtviA or tviA-REP to WT at each time point. D and E) Pyroptotic cell death as measured by lactate dehydrogenase release from primary human monocyte-derived macrophages (hMDMs) from two different donors (Donor 1 D and Donor 2 E) primed overnight with 100 ng/ml LPS and following infection for 2 or 4 hours with WT, ΔfliC, ΔtviA, tviA-REP, tviA-REP ΔfliC, or tviA-DEREP S. Typhi at MOI = 10 or left uninfected. F and G) Corresponding release of IL-1β to 2 hour post-infection time point described in 7D-E. H) Kinetics of hMDM cell death as measured by SYTOX Green positive staining on an IncuCyte S3 after overnight priming with 100 ng/ml LPS and infection with WT, ΔfliC, ΔtviA, tviA-REP, tviA-REP ΔfliC, or tviA-DEREP S. Typhi at MOI = 10 or left uninfected. Asterisks and symbols indicate statistical comparison of ΔtviA or tviA-REP to WT at each time point. I) Western blot of caspase-1 (CASP1), IL-1β, and cleaved N-terminal gasdermin D (NT-GSDMD) in cell lysate plus supernatant of hMDM cells primed overnight with 100 ng/ml LPS and following infection for 2 hours with WT, ΔfliC, ΔtviA, tviA-REP, tviA-REP ΔfliC, or tviA-DEREP S. Typhi at MOI = 25 or left uninfected. Data shown are pooled from 2 (A, B, and C) independent experiments, are individual experiments with hMDMs from two different primary human blood donors (D, E, F, and G), or representative of 2 (H and I) independent experiments performed with hMDMs derived from two different primary human blood donors. Triplicate samples for each condition were used in the experiments in A, B, C, D, E, F, G, and H. Data are represented as mean ± SD. Significance calculated using one-way ANOVA with Tukey’s correction. * p < 0.05, ** p < 0.01, *** p < 0.001, **** p < 0.0001. In C and H, † indicates *** significance and ‡ indicates **** significance.

