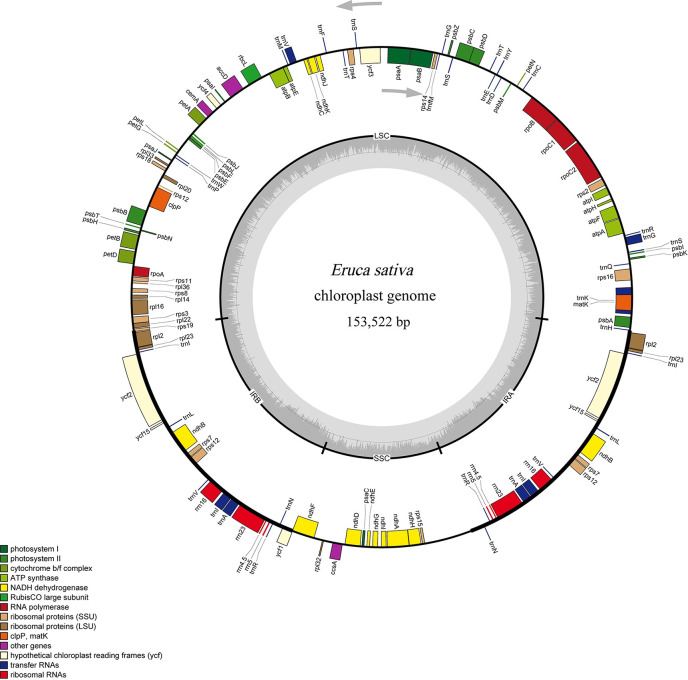
Fig 1. The circle gene map of the E. sativa cp genome.
Genes drawn outside and inside of the circle are transcribed clockwise and counterclockwise, respectively. Genes belonging to different functional groups are color coded. The darker gray in the inner circle corresponds to GC content. SSC region, LSC region, and inverted repeats (IRA and IRB) are indicated.

