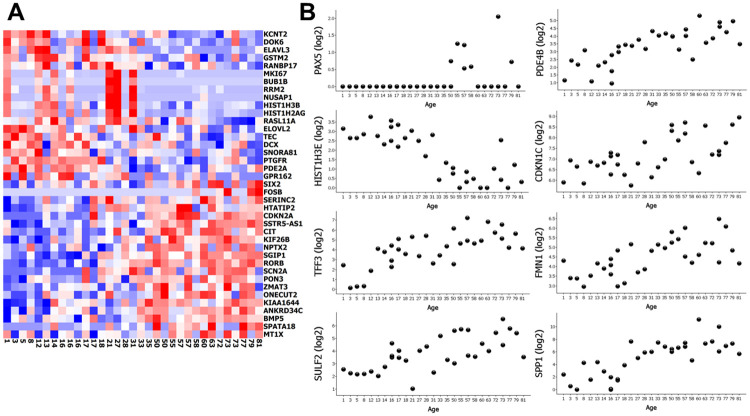
Fig 4. Comparison of differentially expressed genes from a previous study.
A Heat map of the 39 differentially expressed genes overlapping between the study by Arda et al. (comparing isolated islets from old and young donors) and our data (genes that correlated with age in our generalized linear model (FDR<20%) in islets extracted by LCM from donors of increasing age. B Scatter plots of the 8 most significantly differentially expressed genes in our model that did not overlap with the differently expressed genes in Arda et al. Gene counts are presented as log2 values of normalized gene counts. In (A), each column represents one donor and age is noted below.

