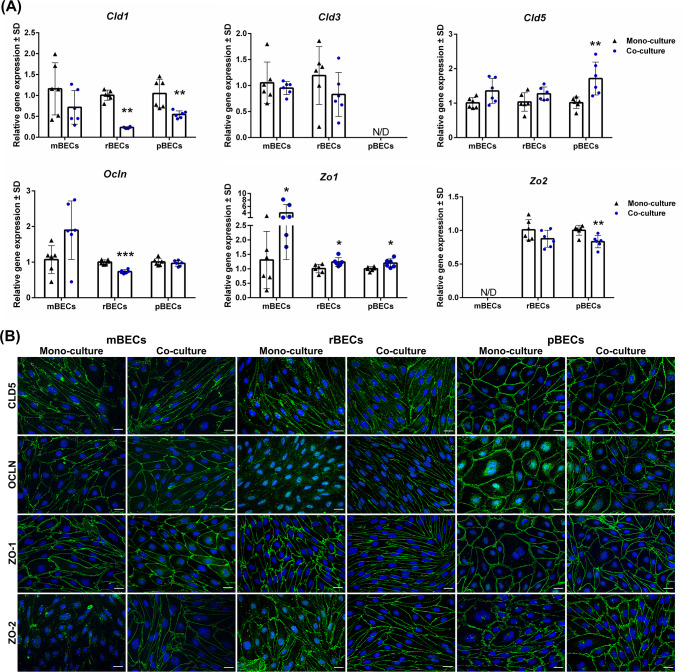
Fig 2. Expression of tight junction proteins.
(A) Relative gene expression of claudin-1,-3,-5 (Cld1, Cld3, and Cld5), occludin (Ocln), and zonula occludens 1 and 2 (Zo1, Zo2) in mouse, rat, and porcine brain capillary endothelial cells (mBECs, rBECs, pBECs) cultured as mono-culture (black triangle) and as co-culture with primary astrocytes (blue circle). The expression pattern of the different tight junction proteins is relatively similar across the three species. Co-culturing the BECs with astrocytes decreases the expression of Cld1 and Zo2 compared to mono-cultured BECs. Oppositely, a significant increase in the expression of Zo1 is seen after co-culturing the BECs. Cld3, Cld5, and Ocln are unaffected by the culturing conditions except when rBECs and pBECs are co-cultured with astrocytes, where a significantly lower expression of Ocln or a significant increase in Cld5 expression is seen, respectively. Despite multiple attempts, the expression of Cld3 and Zo2 is non-detectable in the pBECs and mBECs cultures, respectively. A change in gene expression between mono- and co-cultures for each species is analyzed using an unpaired t-test or non-parametric Mann-Whitney test, depending on the variance of the data. Data are shown as mean ± standard deviation (SD) (n = 6), *p < 0.05, **p < 0.01, ***p < 0.001. (B) Immunofluorescent images showing green labeling at the cell-cell borders of CLD5, OLCN, ZO-1, and ZO-2 in mBECs, rBECs, and pBECs cultured in mono- or co-culture with astrocytes. The BECs express CLD5, OCLN, and ZO1 at the cell-cell interface independently of mono- or co-culturing. mBECs grown in mono-culture do not express ZO-2 at the cell borders, however, a clear expression along the cell border is seen in co-cultured mBECs. Both rBECs and pBECs have a clear expression of ZO-2 along cell borders independent of the culturing conditions. The nuclei are stained with DAPI (blue). Scale bar = 20μM.

