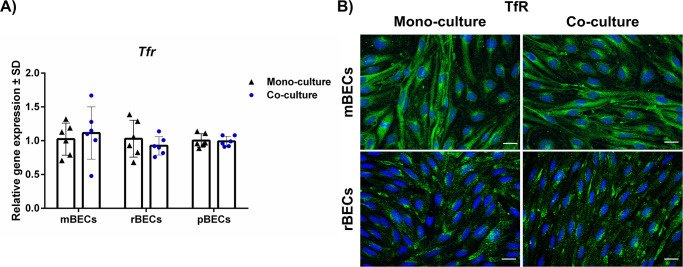
Fig 5. Expression of the transferrin receptor (TfR).
(A) Relative gene expression of Tfr, which is a highly targeted receptor at the BBB for drug delivery purposes, in mouse, rat, and porcine brain capillary endothelial cells (mBECs, rBECs, pBECs) in mono-culture (black triangle) and co-culture with astrocytes (blue circle). Tfr is expressed in all three species independent of the culturing conditions. Changes in gene expression between mono- and co-cultures for each species were analyzed using an unpaired t-test or non-parametric Mann-Whitney test, depending on the variance of the data. No statistical difference was found. Data are shown as mean ± standard deviation (SD) (n = 6). (B) Immunofluorescent images showing green labeling of the TfR in the cell cytoplasm of both mBECs and rBECs, correspondingly well with the intracellular trafficking of the TfR. The nuclei are stained with DAPI (blue). Scale bar = 20μM.

