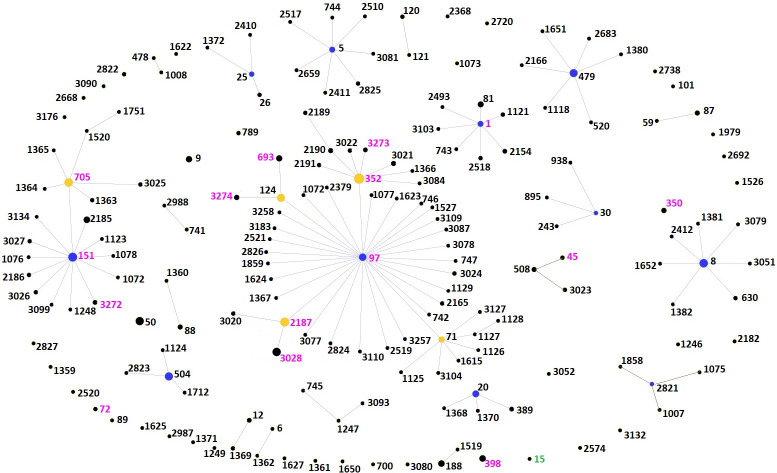
Fig 3. Comparison of the occurrence of S. aureus STs isolated from Pennsylvania milk samples to STs from milk samples from other parts of the world using goeBURST analysis.
Each node represents an ST. The size of the node denotes sample size. The primary founder is shown in blue and subgroup founder is shown in yellow. STs found only in the world milk sample data are in labelled black. STs found in both world milk data and out dataset are labeled pink and ST15 found only in our dataset is labeled green.

