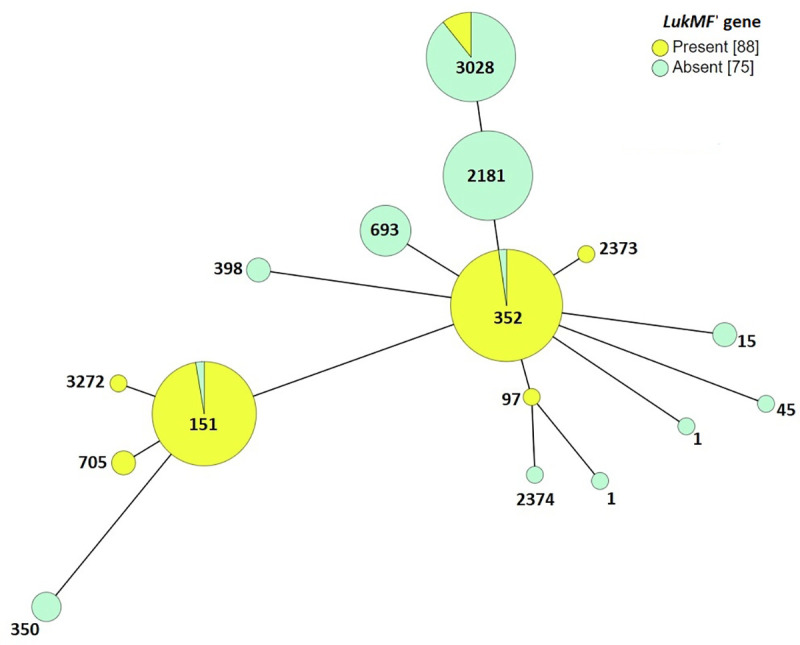
Fig 5. Minimum spanning tree depicting distribution of leukocidin lukMF’ gene among STs from Pennsylvania.

Each node represents an ST which is labeled. Size of the nodes indicate sample size. Predicted founder groups are circled yellow. All connections are shown. The color of the edges indicates connection level, for instance black indicate SLVs, grey DLV etc. Connection levels between STs are also labeled; 1 for SLV, 2 for DLV etc.
