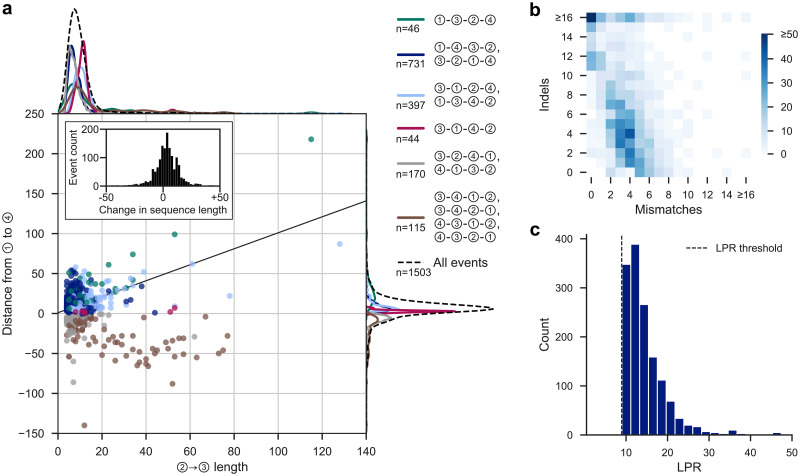
Fig 5. Summary statistics for template switch events in the gold-standard set.
(A) Comparison of ②→③ lengths and the corresponding ①→④ distances for the gold-standard events. The line y = x + 1 corresponds to no net change in sequence length. The inset histogram shows the change in length between the pre- and post-event sequences. Points’ colours correspond to event types (legend, right), with the same colours used to show marginal densities at the top and right of the plot (see also S4 Fig). The marginal densities for all gold-standard events (black dashed lines) are drawn on an enlarged scale, for clarity. (B) Composition of the template switch-generated mutation clusters in the unidirectional alignments in terms of mismatches and indels. Axes are capped at 16 for clarity. (C) LPRs of gold-standard events. The x-axis is capped at 40 for clarity; note that 60 events have a LPR greater than 50. The LPR threshold of 8.95 (Fig 3C) is shown as a dotted line. All summaries are derived from the 1503 events which comprise the gold-standard event set, randomly choosing the output of one pairwise comparison per event.

