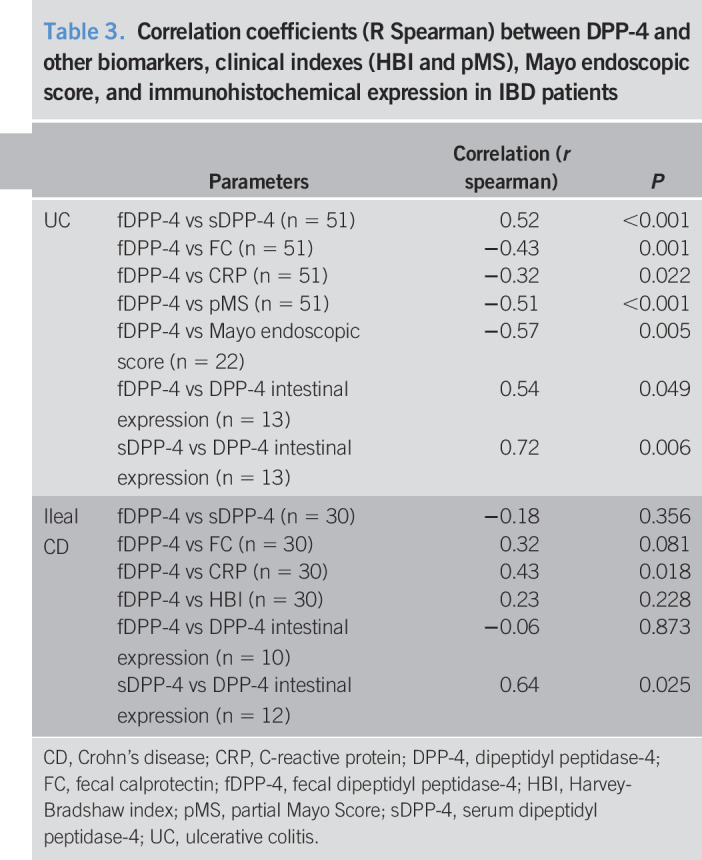
Table 3.
Correlation coefficients (R Spearman) between DPP-4 and other biomarkers, clinical indexes (HBI and pMS), Mayo endoscopic score, and immunohistochemical expression in IBD patients

| Parameters | Correlation (r spearman) | P | |
| UC | fDPP-4 vs sDPP-4 (n = 51) | 0.52 | <0.001 |
| fDPP-4 vs FC (n = 51) | −0.43 | 0.001 | |
| fDPP-4 vs CRP (n = 51) | −0.32 | 0.022 | |
| fDPP-4 vs pMS (n = 51) | −0.51 | <0.001 | |
| fDPP-4 vs Mayo endoscopic score (n = 22) | −0.57 | 0.005 | |
| fDPP-4 vs DPP-4 intestinal expression (n = 13) | 0.54 | 0.049 | |
| sDPP-4 vs DPP-4 intestinal expression (n = 13) | 0.72 | 0.006 | |
| Ileal CD | fDPP-4 vs sDPP-4 (n = 30) | −0.18 | 0.356 |
| fDPP-4 vs FC (n = 30) | 0.32 | 0.081 | |
| fDPP-4 vs CRP (n = 30) | 0.43 | 0.018 | |
| fDPP-4 vs HBI (n = 30) | 0.23 | 0.228 | |
| fDPP-4 vs DPP-4 intestinal expression (n = 10) | −0.06 | 0.873 | |
| sDPP-4 vs DPP-4 intestinal expression (n = 12) | 0.64 | 0.025 |
CD, Crohn's disease; CRP, C-reactive protein; DPP-4, dipeptidyl peptidase-4; FC, fecal calprotectin; fDPP-4, fecal dipeptidyl peptidase-4; HBI, Harvey-Bradshaw index; pMS, partial Mayo Score; sDPP-4, serum dipeptidyl peptidase-4; UC, ulcerative colitis.
