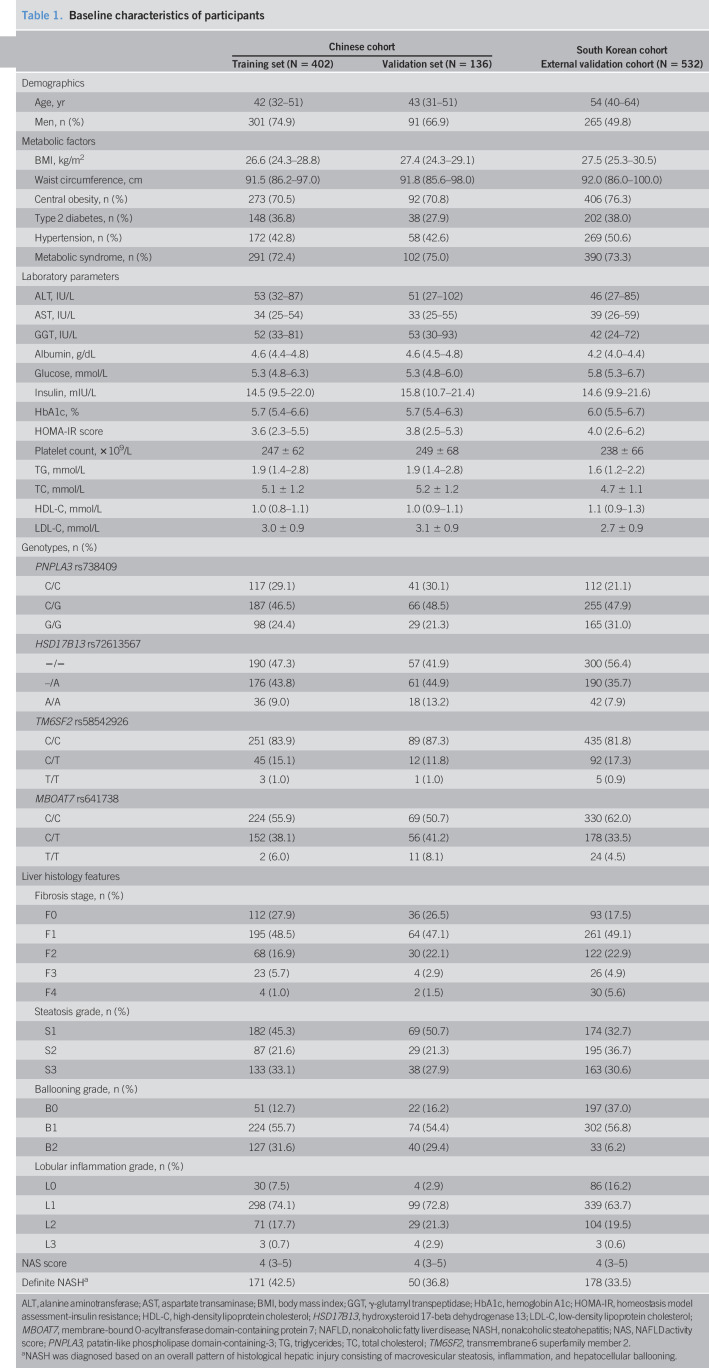
Table 1.
Baseline characteristics of participants
| Chinese cohort | South Korean cohort | ||
| Training set (N = 402) | Validation set (N = 136) | External validation cohort (N = 532) | |
| Demographics | |||
| Age, yr | 42 (32–51) | 43 (31–51) | 54 (40–64) |
| Men, n (%) | 301 (74.9) | 91 (66.9) | 265 (49.8) |
| Metabolic factors | |||
| BMI, kg/m2 | 26.6 (24.3–28.8) | 27.4 (24.3–29.1) | 27.5 (25.3–30.5) |
| Waist circumference, cm | 91.5 (86.2–97.0) | 91.8 (85.6–98.0) | 92.0 (86.0–100.0) |
| Central obesity, n (%) | 273 (70.5) | 92 (70.8) | 406 (76.3) |
| Type 2 diabetes, n (%) | 148 (36.8) | 38 (27.9) | 202 (38.0) |
| Hypertension, n (%) | 172 (42.8) | 58 (42.6) | 269 (50.6) |
| Metabolic syndrome, n (%) | 291 (72.4) | 102 (75.0) | 390 (73.3) |
| Laboratory parameters | |||
| ALT, IU/L | 53 (32–87) | 51 (27–102) | 46 (27–85) |
| AST, IU/L | 34 (25–54) | 33 (25–55) | 39 (26–59) |
| GGT, IU/L | 52 (33–81) | 53 (30–93) | 42 (24–72) |
| Albumin, g/dL | 4.6 (4.4–4.8) | 4.6 (4.5–4.8) | 4.2 (4.0–4.4) |
| Glucose, mmol/L | 5.3 (4.8–6.3) | 5.3 (4.8–6.0) | 5.8 (5.3–6.7) |
| Insulin, mIU/L | 14.5 (9.5–22.0) | 15.8 (10.7–21.4) | 14.6 (9.9–21.6) |
| HbA1c, % | 5.7 (5.4–6.6) | 5.7 (5.4–6.3) | 6.0 (5.5–6.7) |
| HOMA-IR score | 3.6 (2.3–5.5) | 3.8 (2.5–5.3) | 4.0 (2.6–6.2) |
| Platelet count, ×109/L | 247 ± 62 | 249 ± 68 | 238 ± 66 |
| TG, mmol/L | 1.9 (1.4–2.8) | 1.9 (1.4–2.8) | 1.6 (1.2–2.2) |
| TC, mmol/L | 5.1 ± 1.2 | 5.2 ± 1.2 | 4.7 ± 1.1 |
| HDL-C, mmol/L | 1.0 (0.8–1.1) | 1.0 (0.9–1.1) | 1.1 (0.9–1.3) |
| LDL-C, mmol/L | 3.0 ± 0.9 | 3.1 ± 0.9 | 2.7 ± 0.9 |
| Genotypes, n (%) | |||
| PNPLA3 rs738409 | |||
| C/C | 117 (29.1) | 41 (30.1) | 112 (21.1) |
| C/G | 187 (46.5) | 66 (48.5) | 255 (47.9) |
| G/G | 98 (24.4) | 29 (21.3) | 165 (31.0) |
| HSD17B13 rs72613567 | |||
| −/− | 190 (47.3) | 57 (41.9) | 300 (56.4) |
| –/A | 176 (43.8) | 61 (44.9) | 190 (35.7) |
| A/A | 36 (9.0) | 18 (13.2) | 42 (7.9) |
| TM6SF2 rs58542926 | |||
| C/C | 251 (83.9) | 89 (87.3) | 435 (81.8) |
| C/T | 45 (15.1) | 12 (11.8) | 92 (17.3) |
| T/T | 3 (1.0) | 1 (1.0) | 5 (0.9) |
| MBOAT7 rs641738 | |||
| C/C | 224 (55.9) | 69 (50.7) | 330 (62.0) |
| C/T | 152 (38.1) | 56 (41.2) | 178 (33.5) |
| T/T | 2 (6.0) | 11 (8.1) | 24 (4.5) |
| Liver histology features | |||
| Fibrosis stage, n (%) | |||
| F0 | 112 (27.9) | 36 (26.5) | 93 (17.5) |
| F1 | 195 (48.5) | 64 (47.1) | 261 (49.1) |
| F2 | 68 (16.9) | 30 (22.1) | 122 (22.9) |
| F3 | 23 (5.7) | 4 (2.9) | 26 (4.9) |
| F4 | 4 (1.0) | 2 (1.5) | 30 (5.6) |
| Steatosis grade, n (%) | |||
| S1 | 182 (45.3) | 69 (50.7) | 174 (32.7) |
| S2 | 87 (21.6) | 29 (21.3) | 195 (36.7) |
| S3 | 133 (33.1) | 38 (27.9) | 163 (30.6) |
| Ballooning grade, n (%) | |||
| B0 | 51 (12.7) | 22 (16.2) | 197 (37.0) |
| B1 | 224 (55.7) | 74 (54.4) | 302 (56.8) |
| B2 | 127 (31.6) | 40 (29.4) | 33 (6.2) |
| Lobular inflammation grade, n (%) | |||
| L0 | 30 (7.5) | 4 (2.9) | 86 (16.2) |
| L1 | 298 (74.1) | 99 (72.8) | 339 (63.7) |
| L2 | 71 (17.7) | 29 (21.3) | 104 (19.5) |
| L3 | 3 (0.7) | 4 (2.9) | 3 (0.6) |
| NAS score | 4 (3–5) | 4 (3–5) | 4 (3–5) |
| Definite NASHa | 171 (42.5) | 50 (36.8) | 178 (33.5) |
ALT, alanine aminotransferase; AST, aspartate transaminase; BMI, body mass index; GGT, γ-glutamyl transpeptidase; HbA1c, hemoglobin A1c; HOMA-IR, homeostasis model assessment-insulin resistance; HDL-C, high-density lipoprotein cholesterol; HSD17B13, hydroxysteroid 17-beta dehydrogenase 13; LDL-C, low-density lipoprotein cholesterol; MBOAT7, membrane-bound O-acyltransferase domain-containing protein 7; NAFLD, nonalcoholic fatty liver disease; NASH, nonalcoholic steatohepatitis; NAS, NAFLD activity score; PNPLA3, patatin-like phospholipase domain-containing-3; TG, triglycerides; TC, total cholesterol; TM6SF2, transmembrane 6 superfamily member 2.
NASH was diagnosed based on an overall pattern of histological hepatic injury consisting of macrovesicular steatosis, inflammation, and hepatocellular ballooning.

