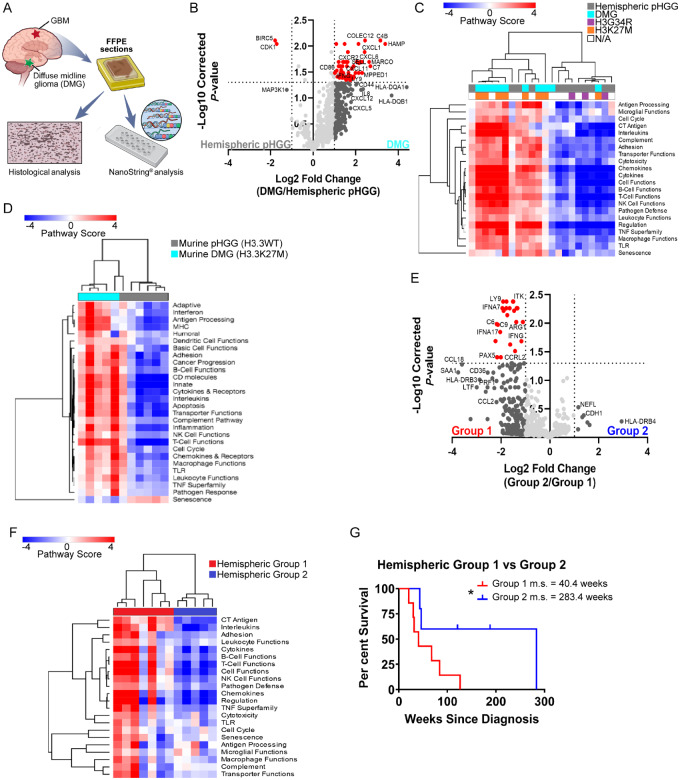
Figure 1.
Immune profiling of human paediatric HGGs. (A) FFPE hemispheric paediatric HGG (n = 12) or DMG (n = 10) human tumour samples were used for NanoString analysis and histological characterization. (B) Volcano plot demonstrating differential gene expression between hemispheric samples and DMG samples. Vertical dashed line = fold change > 2. Horizontal dashed line = Benjamini-Hochberg corrected P < 0.05. (C) Unsupervised hierarchical clustering of human paediatric HGG samples based on pathway scores obtained from NanoString. n = 22 unique samples. (D) Unsupervised hierarchical clustering of murine hemispheric PDGFB-driven paediatric HGG (H3.3WT, n = 6) or DMG (H3.3K27M, n = 5) based on pathway scores obtained from NanoString. (E) Volcano plot demonstrating differential gene expression between human hemispheric samples. (F) Unsupervised hierarchical clustering of human hemispheric samples based on their pathway scores. (G) Survival analysis of human Group 1 hemispheric tumours (more inflammatory) versus Group 2 hemispheric tumours (less inflammatory). Group 1 m.s. = 40.4 weeks, Group 2 m.s. = 283.4 weeks. Log-rank Mantel-Cox test. P < 0.05.

