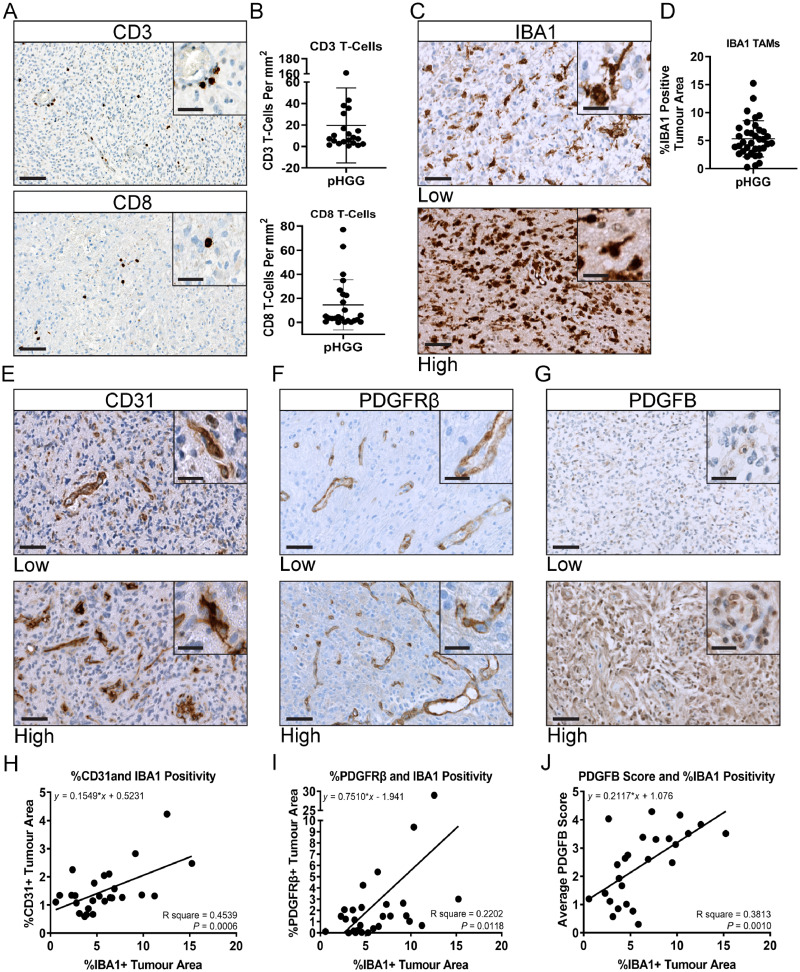
Figure 2.
Neuropathological characterization of human paediatric HGGs. FFPE tumour samples were stained for the following; (A) CD3 and CD8 T cells. (B) Quantification of CD3 (n = 21) and CD8 (n = 24) positivity. (C) IBA1. Representative images for low and high staining samples are displayed. (D) Quantification of IBA1 positivity (n = 36). (E) CD31 (n = 27). (F) PDGFRβ (n = 30). (G) PDGFB (n = 26). (H) Linear regression correlation of CD31+ tumour area with IBA1+ tumour area (n = 26). (I) Correlation of PDGFRβ+ tumour area with IBA1+ tumour area (n = 28). (J) Correlation of PDGFB score with IBA1+ tumour area (n = 25). All images ×40 magnification, ×80 insets. Scale bars = 100 μm and 20 μm, respectively.

