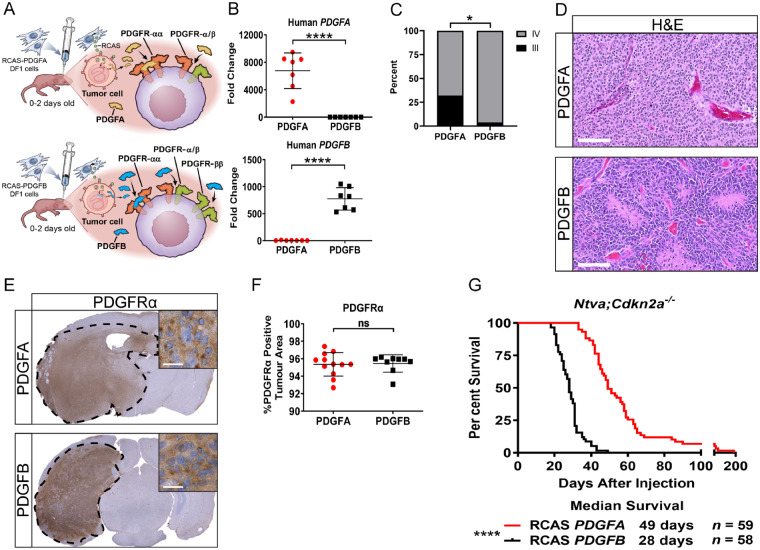
Figure 3.
Mouse modelling of PDGF-driven HGGs. (A) Schematic depicting the injection of newborn pups with RCAS-PDGFA or RCAS-PDGFB. Ligand-receptor binding interactions for PDGFA and PDGFB are highlighted. (B) Quantitative PCR validation for human PDGFA (n = 7) or PDGFB (n = 7) in their respective tumours, P < 0.0001. (C) Tumour grading on samples generated in Ntva;Cdkn2a−/− mice driven by PDGFA (n = 22, 7/22 grade III, 15/22 grade IV) or PDGFB (n = 26, 1/26 grade III, 25/26 grade IV). Fisher’s exact test, P = 0.0167. (D) Representative haematoxylin and eosin images of PDGFA and PDGFB-driven tumours. Scale bar = 100 μm. (E) Whole brain PDGFRα staining in PDGFA (n = 12) and PDGFB-driven (n = 9) tumours. Inset ×80, scale bar = 20 μm. (F) Quantification of PDGFRα staining. (G) Survival curves of Ntva;Cdkn2a−/− mice with tumours driven by RCAS-PDGFA or RCAS-PDGFB, P < 0.0001. Student’s t-test for quantifications, Log-rank Mantel-Cox test for survival curves.

