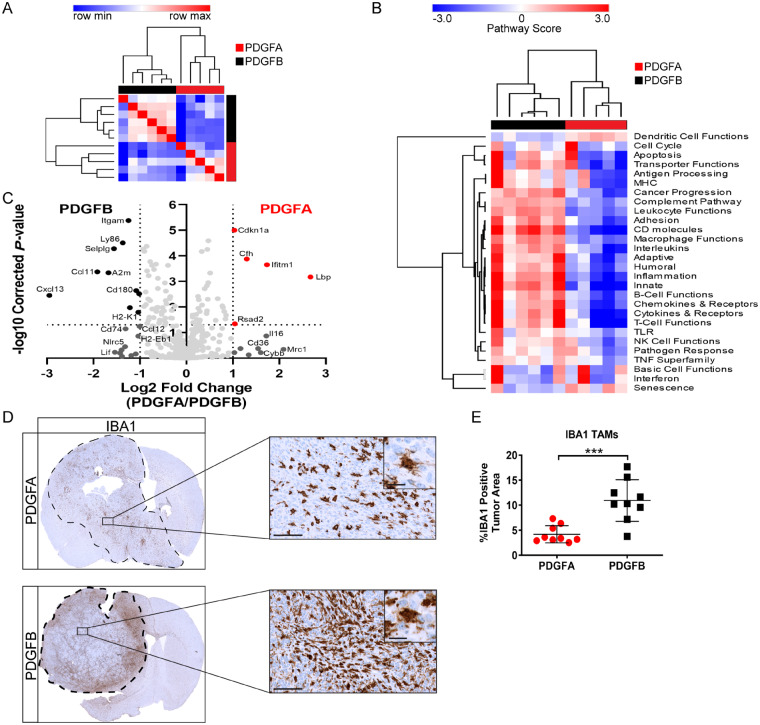
Figure 4.
Inflammatory microenvironment of PDGF-driven mouse tumours. (A) Similarity matrix performed on PDGFA (n = 5) and PDGFB (n = 6) tumour samples generated in Ntva;Cdkn2a−/− mice based on the expression of 750 genes detected using NanoString. (B) Unsupervised hierarchical clustering of PDGFA and PDGFB tumour samples based on pathway scores obtained from NanoString. (C) Volcano plot of differentially expressed genes detected using NanoString. (D) IBA1 staining on PDGFA and PDGFB tumours. Images magnified ×40 and ×80, scale bars = 100 μm and 20 μm, respectively. (E) Quantification of IBA1 staining. PDGFA n = 9, PDGFB n = 9. Student’s t-test, P = 0.0004.

