Figure 5.
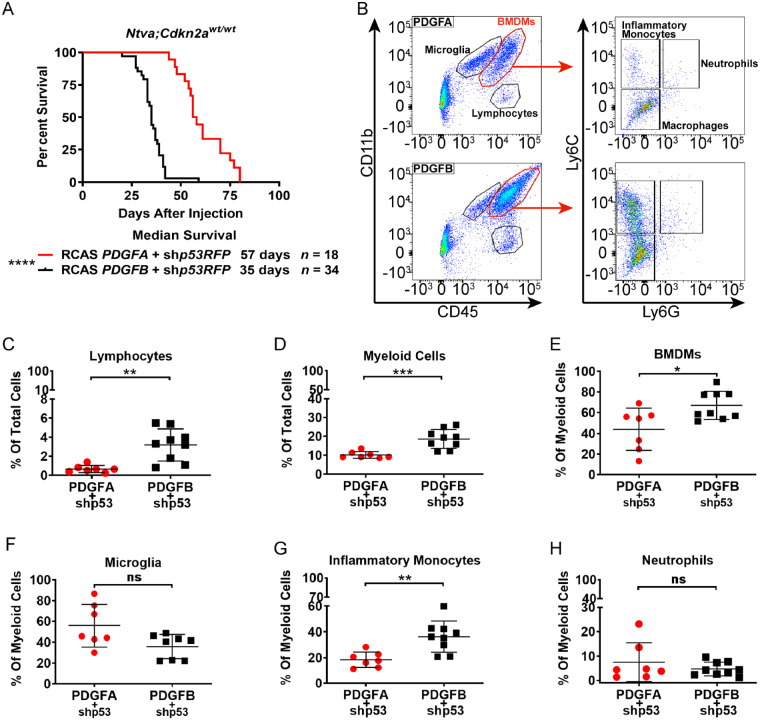
Flow cytometry of PDGF-driven mouse tumours. (A) Survival curves for Ntva;Cdkn2awt/wt mice with tumours induced by RCAS-PDGFA or RCAS-PDGFB with co-administration of RCAS-shP53. Log-rank Mantel-Cox test, P < 0.0001. (B) Representative flow cytometry dot plots of PDGFA (n = 7) and PDGFB-driven (n = 9) tumours generated in Ntva;Cdkn2awt/wt mice, gated for CD45, CD11b, Ly6C, and Ly6G. (C) %CD45hiCD11b− lymphocytes in the total tumour cell population. (D) %CD45+CD11b+ myeloid cells in the total tumour cell population, P = 0.0008. (E) %CD45hiCD11b+ BMDMs in the total myeloid cell population, P = 0.0171. (F) %CD45l°CD11b+ microglia in the total myeloid cell population. (G) %CD45hiCD11b+Ly6ChiLy6Glo inflammatory monocytes in the total BMDM population, P = 0.0030. (H) %CD45hiCD11b+Ly6ChiLy6Ghi neutrophils in the total BMDM population. Student’s t-test. ns = not significant.

