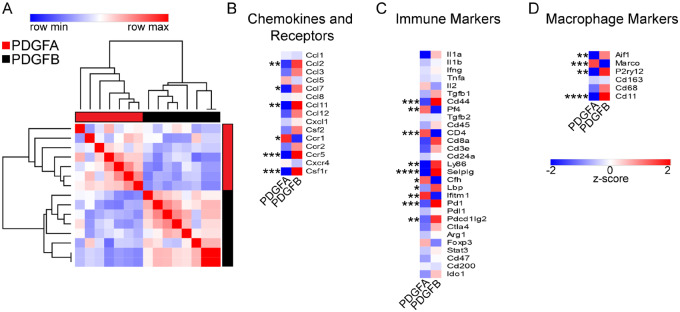
Figure 6.
Quantitative PCR molecular characterization of PDGF-driven mouse tumours. (A) Similarity matrix of PDGFA (n = 7) and PDGFB-driven (n = 7) tumours generated in Ntva;Cdkn2a−/− mice. Samples are clustered by their expression of 72 genes detected by qPCR. (B) Averaged z-scores for PDGFA and PDGFB-driven tumour samples based on their expression of chemokines and chemokine receptor genes. (C) Averaged z-scores for immune-related genes. (D) Averaged z-scores for macrophage related genes. Student’s t-test.

