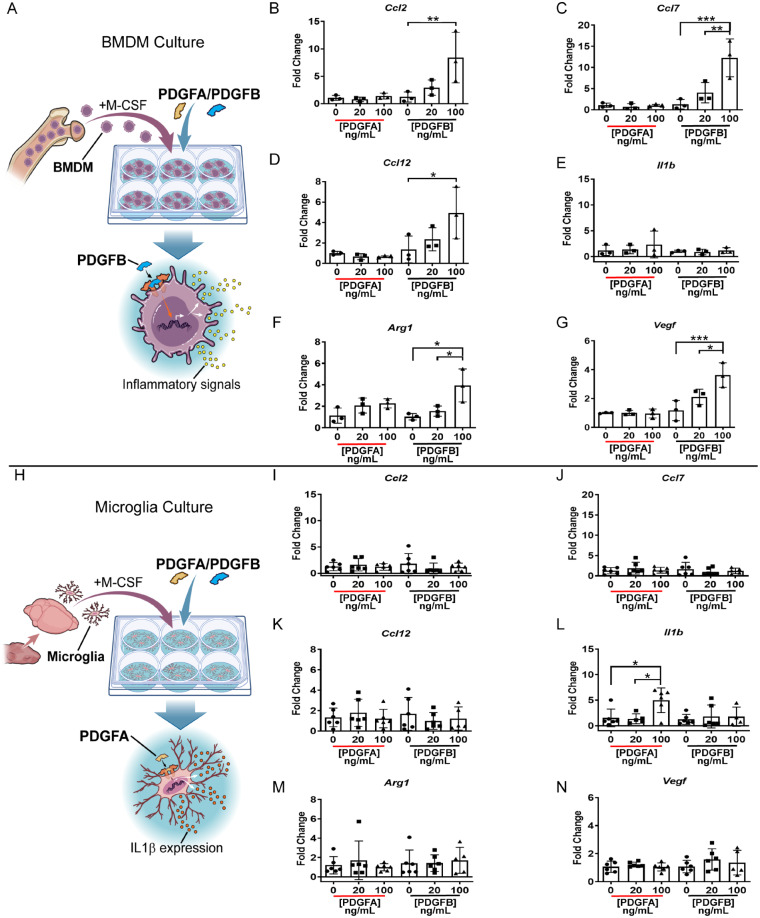
Figure 7.
In vitro PDGF stimulation of BMDMs and microglia. (A) Schematic depicting the isolation and culture of BMDMs from naïve CL57BL/6 mouse bone marrow. BMDMs were stimulated with either PDGFA or PDGFB for 6 h prior to RNA isolation. (B–G) Quantitative PCR plots on BMDM samples stimulated with either PDGFA or PDGFB at 0 ng/ml, 20 ng/ml, or 100 ng/ml. n = 3 independent replicates per concentration. (H) Schematic depicting the isolation and culture of microglia from naïve newborn CL57BL/6 pup brains. Microglia were cultured with M-CSF and stimulated with either PDGFA or PDGFB for 6 h prior to RNA isolation. (I–N) Quantitative PCR plots on stimulated microglia. n = 5 independent replicates per concentration. One-way ANOVA multiple comparisons.

