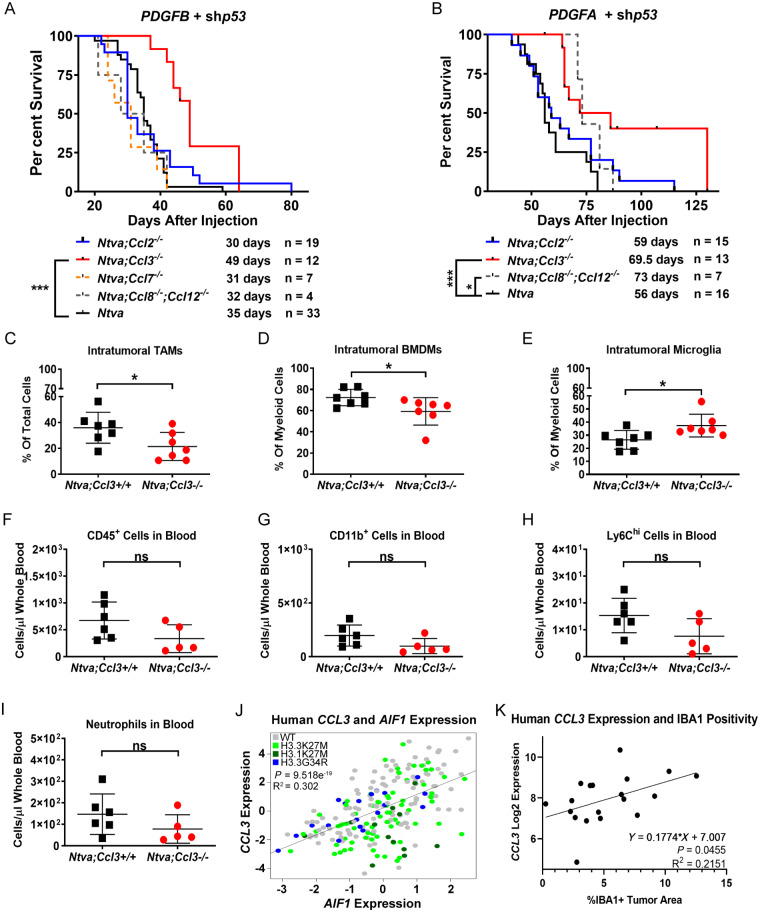
Figure 8.
Chemokine knockout extends survival. (A) Survival curves of RCAS-PDGFB + RCAS-shP53 driven tumours in Ntva;Ccl2−/−, Ntva;Ccl3−/− (P = 0.0004), Ntva;Ccl7−/−, Ntva;Ccl8/12−/−, and Ntva mice. (B) Survival curves of RCAS-PDGFA + RCAS-shP53 driven tumours in Ntva;Ccl2−/−, Ntva;Ccl3−/− (P = 0.0006), Ntva;Ccl8/12−/− (P = 0.0102), and Ntva mice. Log-rank Mantel-Cox test. (C) %CD45+CD11b+ TAMs in the total tumour cell population in Ntva;Ccl3+/+ mice (n = 7) or Ntva;Ccl3−/− mice (n = 7) driven by RCAS-PDGFB and RCAS-shP53. P = 0.0354. (D) %CD45hiCD11b+ BMDMs in the total myeloid cell population. P = 0.0409. (E) %CD45l°CD11b+ microglia in the total myeloid cell population. P = 0.0248. (F) Number of CD45+ cells in the blood of Ntva;Ccl3+/+ mice (n = 6) or Ntva;Ccl3−/− mice (n = 5). (G) CD11b+ cells in the blood. (H) Ly6chi cells in the blood. (I) Neutrophils in the blood. (J) CCL3 expression correlated with AIF1 in human paediatric HGG RNA sequencing data. n = 220. (K) CCL3 expression obtained from NanoString in human paediatric HGGs correlated with IBA1 positivity in matched samples. n = 19.

