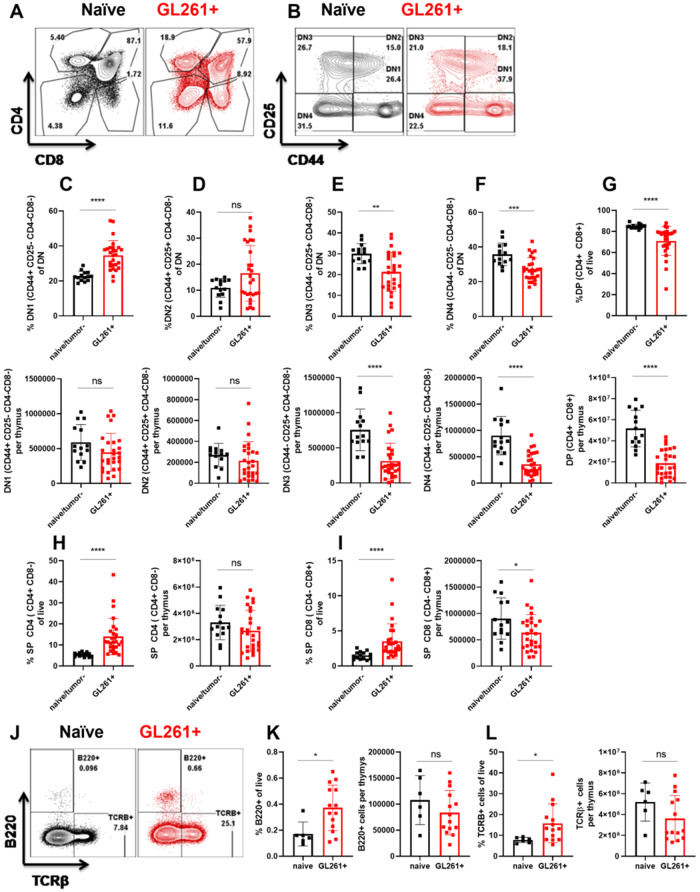
Figure 2.
Brain tumours induce changes within the thymus that dysregulate T-cell development. (A and B) Gating strategy is shown using representative naïve and glioma-bearing mice. (A) Following gating on singlets, live, and CD45+ cells, we used CD4 and CD8 parameters to determine double-negative (DN), double-positive (DP), SP4 (single-positive CD4), and SP8 (single-positive CD8) T cells. (B) We then focused on the double-negative gate to define DN1–4 populations. DN1 is defined as CD44+CD25−, DN2 is defined as CD44+CD25+, DN3 is defined as CD44−CD25+, and DN4 is defined as CD44−CD25− populations within the double-negative gate. (C–G) Frequencies (top) and numbers (bottom) of DN1–DN4 and double-positive cells are quantified between naïve or tumour (−), and glioma-bearing mice. (H and I) Frequencies and numbers of single-positive CD4 and CD8 T cells are quantified. n = 14–27. Data are shown as individual mice with mean. Data are pooled from two independent experiments. This experiment was repeated five times and similar results were obtained. Error bars represent standard deviation. Mann-Whitney U-test was used to assess statistical significance. ns: P ≥ 0.05, *P = 0.01 to 0.05, **P = 0.001 to 0.01, ***P = 0.0001 to 0.001, ****P < 0.0001. (J) Post selection TCRβ+ cells and B220+ B cells within the thymus are increased in glioma-bearing mice compared to controls. (K) Frequencies and numbers of thymic B cells are quantified. (L) Frequencies and numbers of TCRβ+ cells in the thymus are quantified. n = 6–14. Data are shown as individual mice with mean. Error bars represent standard deviation. Mann-Whitney U-test was used to assess statistical significance. ns: P ≥ 0.05, *P = 0.01 to 0.05, **P = 0.001 to 0.01, ***P = 0.0001 to 0.001, ****P < 0.0001.

