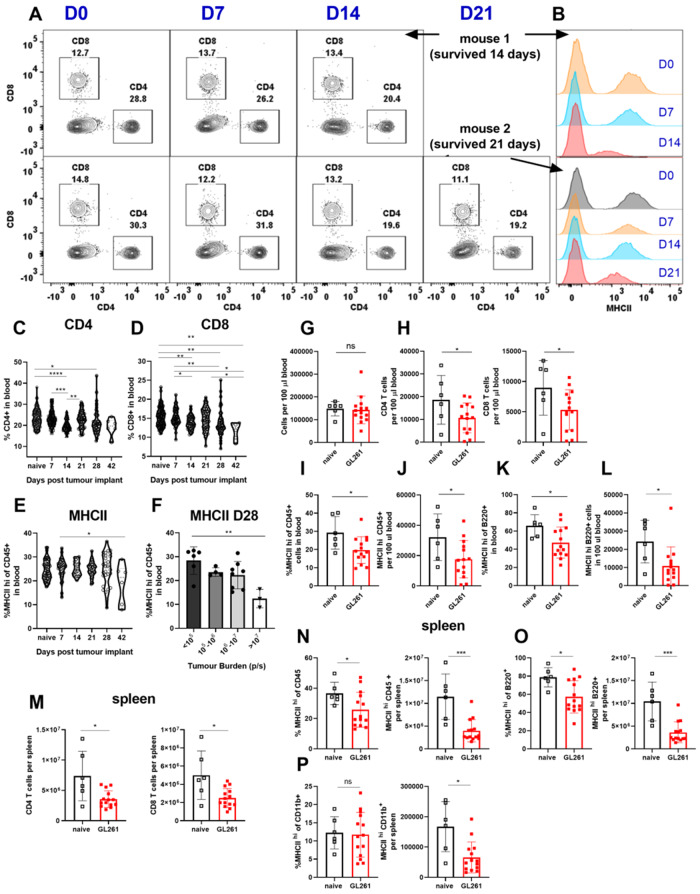
Figure 4.
Mice harbouring GL261 gliomas exhibit peripheral immunosuppression consistent with patients with GBM. (A) CD4 and CD8 T-cell levels are tracked through weekly bleeding in individual mice. (B) MHCII expression on all CD45+ cells in blood is tracked weekly in individual mice. (C and D) Two representative mice are shown. (C) Frequencies of CD4 and (D) CD8 and (E) MHCII expression on CD45+ cells in blood are tracked across GL261 implanted mice through weekly bleeding (n = 6–124). Data are pooled from four to five independent experiments. (I) Variability in MHCII expression on blood CD45+ cells on Day 28 is plotted as a function of tumour burden as measured by bioluminescence intensity (n = 3–8) data are pooled from two independent experiments. (G) Total cells per 100 µl of blood do not change between naïve and glioma bearing mice. Blood comparisons in G–L are made at times when GL261-bearing mice became moribund. (H) Reduction in frequency of CD4 and CD8 T cells translates into a reduction in total counts of CD4 and CD8 T cells in blood. (I) Frequency and (J) number of CD45+ cells in blood with high expression of MHCII is quantified. Similarly, (K) frequency and (L) numbers of B cells with high levels of MHCII expression in blood are decreased in glioma-bearing mice compared to controls. (M) Numbers of CD4, and CD8 T cells, and (N) frequencies and numbers of MHCIIhi CD45+, (O) MHCIIhi B cells, and (P) counts of MHCIIhi CD11b+ cells are compared between glioma-bearing and naïve mice in the spleen. For T-cell gating: we gated on singlets, live, CD45+, TCRβ+ B220−, CD4+ or CD8+ cells. For B-cell gating, we used singlets, live, CD45+, or TCRβ−B220+ cells. For CD11b gating, we used singlets, live, CD45+, TCRβ−B220−, or CD11b+ cells. Data are shown as individual mice with mean. Error bars represent standard deviation. One-way ANOVA with Tukey's multiple comparisons test was used to assess statistical significance for C–F. Mann-Whitney U-test was used to assess statistical significance in G–P. ns: P ≥ 0.05, *P = 0.01 to 0.05, **P = 0.001 to 0.01, ***P = 0.0001 to 0.001, ****P < 0.0001.

