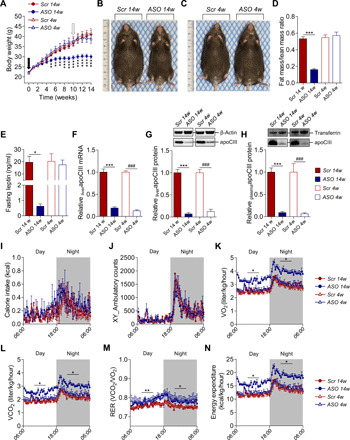
Fig. 1. Lowering apoCIII in mice on HFD improves the metabolic status.

(A) Body weight (BW). Black arrow indicates start of ASO treatment in the prevention study (week 0), and white arrow in the reversibility study (week 10, N = 10 to 11). (B and C) Representative pictures of mice treated for (B) 14 weeks with Scr (left) and ASO (right) and (C) 4 weeks with Scr (left) and ASO (right). (D) Fat–to–lean mass ratio analyzed with NMR (N = 6). (E) Twelve-hour fasting plasma leptin levels (N = 4). (F) Liver mRNA levels of apoCIII analyzed by qRT-PCR (N = 10). (G and H) Representative immunoblots and densitometry analysis of apoCIII in (G) liver and (H) plasma (N = 7 and 6, respectively). (I to N) Parameters evaluated in metabolic cages (CLAMS) at the end of the studies (N = 7 to 8). (I) Calorie intake. (J) Locomotion (x and y axes). (K) Oxygen consumption (VO2). (L) Carbon dioxide production (VCO2). (M) Respiratory exchange ratio (RER). (N) Calculated energy expenditure (EE). Data are presented as mean ± SEM. *ASO 14w versus Scr 14w; #ASO 4w versus Scr 4w. Single symbol, P < 0.05; double symbol, P < 0.01; and triple symbol, P < 0.001. Photo credit: Ismael Valladolid-Acebes, The Rolf Luft Research Center for Diabetes and Endocrinology, Karolinska Institutet.
