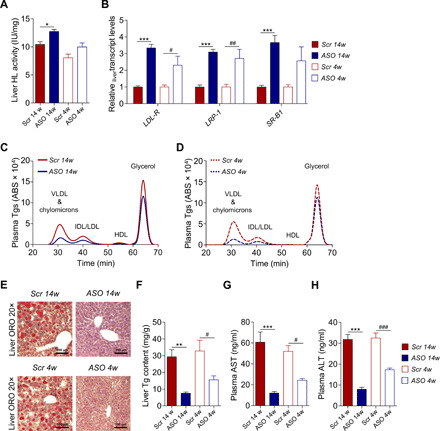
Fig. 3. Liver function in ASO-treated mice on HFD.

(A) Hepatic lipase (HL) activity in liver samples (N = 6). (B) Gene expression levels of receptors involved in hepatic lipid clearance by qRT-PCR (N = 5 to 6). (C and D) Representative chromatograms for Tg lipid profiles measured in VLDL and chylomicron–, IDL/LDL-, HDL-, and glycerol-eluted plasma fractions at the end of (C) prevention and (D) reversibility study (N = 6). (E) Representative images of ORO-stained cryosections from liver. Nuclei counterstained with hematoxylin. Scale bar, 100 μm (N = 4). (F) Spectrophotometric measurements of liver Tg content (N = 6). (G and H) Nonfasting plasma (G) AST and (H) ALT (N = 6). Data are presented as mean ± SEM. *ASO 14w versus Scr 14w; #ASO 4w versus Scr 4w. Single symbol, P < 0.05; double symbol, P < 0.01; and triple symbol, P < 0.001.
