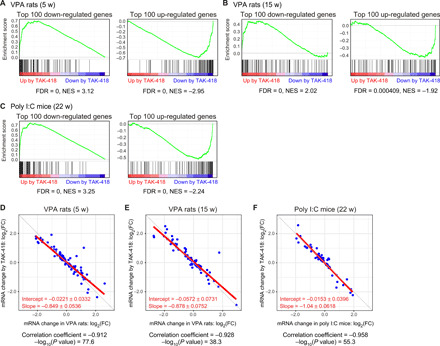
Fig. 2. TAK-418 normalizes mRNA expression dysregulated in VPA rats and poly I:C mice.

(A to C) GSEA plots for the top 100 dysregulated (down-regulated/up-regulated) genes with low q values in 5-week-old (A) and 15-week-old (B) VPA rats and 22-week-old poly I:C mice (C) in the ranked list of genes modified by TAK-418 (red, up-regulation by TAK-418; blue, down-regulation by TAK-418). The green curves correspond to the enrichment score curves: The running sums of the weighted enrichment score obtained from GSEA software. Normalized enrichment score (NES) and corresponding FDR values are shown in each panel. (D to F) Scatter plots and Pearson’s correlation analysis between mRNA expression alteration patterns and the effects of TAK-418 on mRNA expression in 5-week-old (D) and 15-week-old VPA rats (E) and 22-week-old poly I:C mice (F). x axis, FC values of mRNA expression levels in disease model animals relative to those in control animal; y axis, FC values of mRNA expression levels in TAK-418–treated disease model animals relative to vehicle-treated model animals. Fitted regression lines and their slopes and intercepts with 95% confidence intervals are shown in red.
